Real estate firm Cushman & Wakefield recently published a look at US ports, in a report filled with numbers and charts that updates the state of US ports from many angles.
Supply Chain Digest Says... |
 |
|
| Some experts are saying more dramatic cuts in ship sailings will be needed to stem the rate collapse. |
|
 |
|
What do you say? |
|
| Click here to send us your comments |
|
| |
|
| Click here to see reader feedback |
|
|
|
The data unless otherwise noted, are through the 1H of 2022, with numbers for this full year estimated on an annualized basis based on 1H data and usual 2H trends.
What are the largest US ports by container volumes handle (as measured by TEU volume)? Through June, the port of Los Angeles usual led the way, processing about 5.4 million TEU, followed closely by LA’s sister port of Long Beach, at just over 5 million TEU.
Number 3 was the port of New York/New Jersey, at just under 5 million TEU, but SCDigest notes that for the month of August, New York/New Jersey surpassed both LA and Long Beach in container volumes, though combined the twin California ports are of course much larger.
Rounding out the top 10 are: (4) Savannah; (5) Houston; (6) Virginia; (7) Seattle/Spokane; (8) Charleston; (9) Oakland; and (10) Jacksonville.
Next, what share of total container volumes do those top 10 ports handle? Quite a bit, Cushman & Wakefield finds. Over the last few years, the top 10 maritime ports have accounted for approximately 85% of TEU volume handled throughout the US.
Within the top 10, lots of dynamics, especially in 1H 20222.
The Port of Los Angeles saw a 0.3% decrease in activity compared to mid-year 2021, while Jacksonville and Oakland saw year-over-year volumes decrease 9.6% and 5.5%, respectively. But as some container ships from Asian were redirected away from West Coast ports this year due to long waits to unload, large increases were seen at the Ports of Houston (+29.4%), Charleston (+21.2%), and NY/NJ (+12.4%).
In fact, the Port of Los Angeles’ market share has declined modestly since the close of 2021 (20.2%) to 19.6%, while the Ports of Long Beach and NY/NJ each saw its market share climb 0.4% points and 0.7%, respectively, over the same period to 18.1% and 17.7%. West Coast ports accounted for 48.6% of cargo volume handled during the first half of 2022, down from 49.6% at year-end 2021.
As can be seen in the chart below, annual growth in container volumes for the top 10 ports has been up and down for the past 10 years (represented by the light blue line in the graphic below from the report), but spiked to 15% in 2021, but now expected to be just over 4% in 2022.
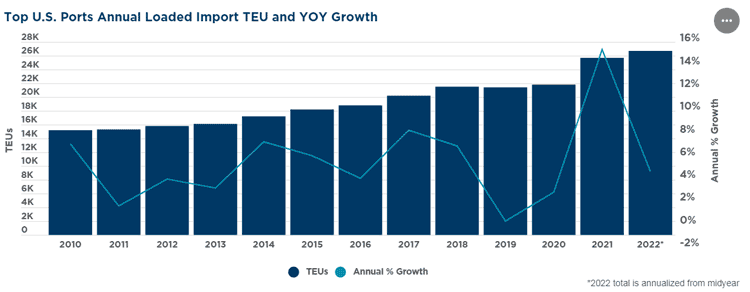
Source: Cushman & Wakefield
The research also looked at warehousing around US ports.
(See More Below)
|
CATEGORY SPONSOR: SOFTEON |
|
|
|
|
|
“Port industrial markets have proven to be some of the strongest in the nation as they feed some of the country’s most populous metropolitan areas,” the report notes, adding that “The industrial markets surrounding the top 10 U.S. ports encompass over 4.0 billion square feet of space, representing about 25% of the national total.”
What’s more, many of the industrial markets around ports have experienced tighter market conditions than the US overall, with seven port areas seeing vacancy rates of 2.0% or lower as of mid-year 2022, including the Inland Empire near LA (0.6%), Savannah (0.6%), Los Angeles (1.0%) and New Jersey (2.0%).
As a result, rents for warehouse space around ports continues to rise and have been priced at a premium over most other markets. At $12.09 per square foot (psf), the average asking rent for port markets finished Q2 44.7% over the US average of $8.36 psf, according to Cushman & Wakefield data.
The chart below from the report does a nice job of summarizing a large amount of information about warehousing across a collection of markets near some of the largest ports:
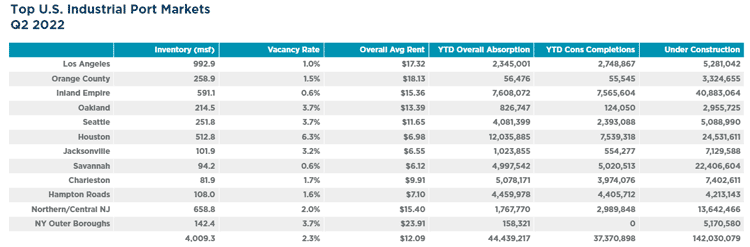
Source: Cushman & Wakefield
You can find the full report here: 2022 US Ports Update
What are your thoughts on this US port data? Let us know your thoughts at the Feedback section below.
Your Comments/Feedback
|