Of the three primary components of working capital performance, the payables area is perhaps the most controversial.
Precise definitions vary a bit, but in general the three areas that impact working capital are:
Supply Chain Digest Says... |
 |
| REL found the top quintile (20%) had an average DPO level of 59.1 days, 45% longer than the median DPO of 40.9. |
 |
What do you say? |
| Click here to send us your comments |
 |
| Click here to see reader feedback |
|
|
• How fast a company collects cash from its customers (accounts receivable)
• How much inventory a company holds
• How fast (or slow) a company pays its suppliers (accounts payable)
That latter element is somewhat controversial because to make improvements to working capital (and therefore cash flow), a company has to stretch out payments to suppliers, which is great for a company's own metrics but comes at the expense of its suppliers' own cash flows and financial metrics.
For the past several years, SCDigest has performed analysis on the annual working capital data for the 1000 largest US companies compiled by REL, a Hackett Group company. We focus on the inventory component (see Inventory Performance 2016), and part of what we do is to recategorize the companies in the REL data set into more precise sectors. We also eliminate companies and categories that don't really operate physical supply chains in any meaningful way, such as banking, insurance companies, etc.
This year will again also look at trends in payables as well. The data for the 2016 report is for the 2015 financial year.
REL tracks the payables metric in terms of Days Payables Outstanding (DPO), which measures how many day's worth of cost of goods sold a company has in terms of payables. REL thus defines DPO as:
Year-End Accounts Payable /(Total Cost of Goods Sold/365)
As such, it is roughly the measure in days of how long a company takes on average to pay suppliers.
That means an increase in DPO is an improvement, and a decrease a deterioration. For working capital and cash flow purposes, stretching out supplier payments is a good thing, regardless of the "business ethics" questions that could arise.
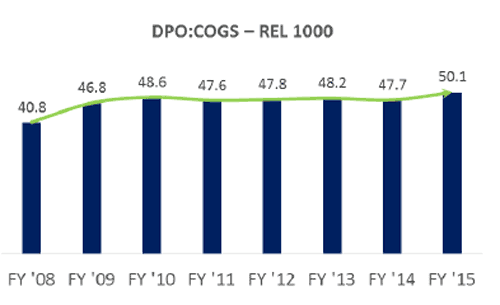
Overall, across all 1000 companies in the data set, REL found DPO jumped about 5% in 2015 versus 2014, to 50.1 days, a change from the flat performance seen from 2010-2014, as shown in the graphic below.
Changes to DPO Levels over Time, 1000 Largest US Public Companies

Source: REL
The numbers were very similar for the reduce list of about 550 companies analyzed by SCDigest from the original REL list, for which the average DPO was 52 days in 2015, up 2.3% from 50.8 in 2014.
(See More Below)
|
CATEGORY SPONSOR: SOFTEON |
|
|
| |
|
|
REL believes companies in aggregate have substantial opportunity to improve working capital by increasing Days Payables Outstanding, finding for example that the top quintile (20%) had an average DPO level of 59.1 days, 45% longer than the median DPO of 40.9.
REL says that difference is $49.9 million of cash flow per $1 billion of sales.
Here are the average 2015 DPO metrics for a number of select industry sectors:
• Consumer Packaged Goods: 70
• Pharmaceuticals:125
• Mass Merchants, Dept. Stores, and Club Stores: 47
• Chemicals and Gases: 48
• Apparel and Shoe Manufacturers: 55
• Retail Grocery: 20
• Wholesale - Industrial and Electronics: 36
• Aerospace & Defense Components: 40
• Autoparts/Components: 54
• Contract Manufacturers: 62
• Computer Hardware & Peripherals: 72
• Construction Equipment: 44
• Containers & Packaging: 52
• Food Manufacturers: 43
• Machinery: 44
• Medical Devices and Supplies: 45
• Metals Manufacturing and Distribution:
• Personal Care Products: 114
Why such a huge variance in terms of payables practices? That is a trillion dollar question.
Any reaction to these payable numbers? Why such huge differences between sectors? Let us know your thoughts at the Feedback section below.
Your Comments/Feedback
|