Which US states are best for manufacturing?
The researchers at Ball State University's Center for Business and Economic Research, with its partners at an organization called Conexus Indiana, have as usual released their 2019 Manufacturing and Logistics Report Card.
Supply Chain Digest Says... |
 |
| Indiana was followed in the top 5 by Utah, North Carolina, South Dakotai, and Florida. |
 |
What do you say? |
| + to send us your comments |
 |
| Click here to see reader feedback |
|
|
Among other insights, the report rates each US state in terms of its attractiveness for manfacturing based on nine different factors.
Those are:
Manufacturing Health: Rating includes three variables: the share of total income
earned by manufacturing employees in each state, the wage premium paid to manufacturing workers
relative to the other states' employees, and the share of manufacturing employment per capita.
Logistics Health: Rating includes total logistics industry income as a share of total state income and the
employment per capita. Also included is a measure infrastructure spending as the per capita expenditure on highway construction.
Human Capital: Rating includes rankings of educational
attainment at the high school and collegiate level, the first-year retention
rate of adults in community and technical colleges, the number of
associates degrees awarded annually on a per capita basis, and the share of
adults enrolled in adult basic education.
Worker Benefit Costs: Rating includes include data on health care premiums and
long-term health care costs, workers' compensation costs per worker, and
fringe benefits of all kinds as a share of worker costs.
Tax Climate: Rating includes data on corporate taxes, income and
sales and use taxes, property and unemployment insurance tax data
collected by the Tax Foundation.
Expected Fiscal Liability Gap: Rating includes the expected fiscal liability gap, we include data on unfunded
liability per capita and percentage of GDP, average benefits, and bond
rankings.
Global Reach: Rating includes include the export-related measures of per
capita exported manufacturing goods and the growth of manufacturing
exports. Also included is foreign-direct investment in a state, the level of adaptability of the state's exporters to changing
demand, as well as the reach of foreign direct investment.
Sector Diversification: Includes use of the
Herfindahl-Hirschman Index , which can be used to rank each state from the most diverse
(1st) to the least diverse (50th).
Productivity and Innovation: Rating includes manufacturing
productivity growth, industry R&D expenditures on a per capita basis, and
the per capita number of patents issued annually.
The report then gives each state a grade from A to F on each of the nine factors, including pluses and minuses, and indicates whether that score is up, down, or flat from the previous year. But oddly, it does not produce a summary score and rankings across all the nine atributes.
(Article Continued Below)
|
CATEGORY SPONSOR: SOFTEON |
|
|
| |
|
|
SCDigest to the rescue. We took the Conexus Indiana data and assigned a numeric score to each letter grade, the way it is typically done to produce a school grade point average. That is: A = 4.0, A- = 3.7, B+ = 3.3., etc.
The scores for each state were then averaged evenly across categories, producing the best to worst ranking, as shown in the table below:
Composite Scores of the Best States for Manufacturing 2019
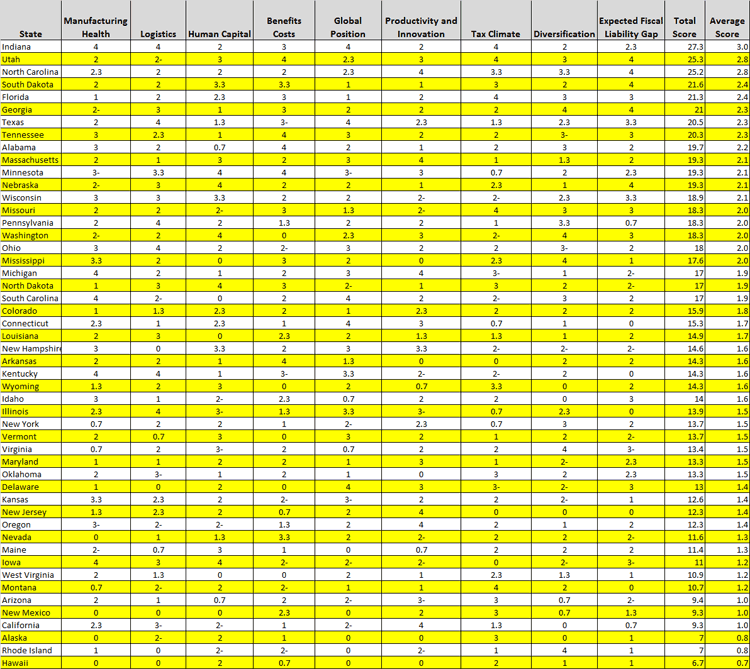
Source: SCDigest Analysis from 2019 Manufacturing and Logistics Report Card Date
As can be seen, under this system, Indiana comes out on top again this year as it did in 2018 with roughly a B composite average - convenient for the Indiana-based Ball State analysts. Indiana was followed in the top 5 by Utah, North Carolina, South Dakota, and Florida.
Hawaii was dead last, barely below Rhode Island, Alaska, California and New Mexico, with roughly D and D- average scores.
Was the fix in for Indiana in the research? SCDigest doesn't believe so. The Hoosier state has made itself very manufacturing friendly in recent years, such as approving right to work legislation and reducing taxes, and indeed has one of the top percentages of manufactucturing jobs relative to total jobs of any state in the nation.
Any reaction to ranking of states for manufacturing attractiveness? Let us know your thoughts at the Feedback section below.
Your Comments/Feedback
|