Real estate firm JLL and analyst Mehtab Randhawa recently released its Q1 Industrial Outlook covering trends and transaction in the market for warehouse and distribution center space.
Supply Chain Digest Says... |
|
|
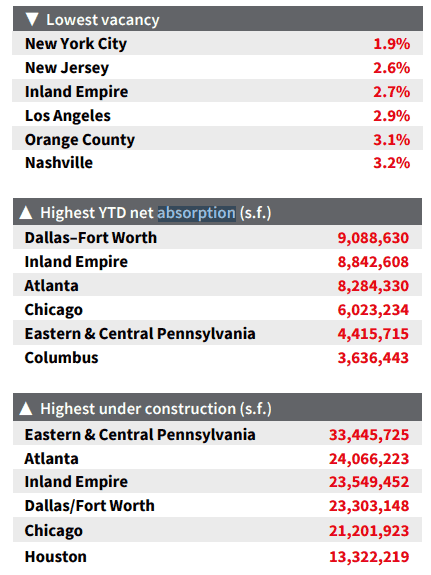
The headline news: net absorption of space was the second-highest on record, with 85.6 million square feet becoming occupied.
There are a number of charts in the report, and we will let those graphics most of tthe story this time, starting with a look at markets with the lowest vacancy rates, top “net absorption” of warehouse space, and most space currently under construction:

Source: JLL
(See More Below)
|
CATEGORY SPONSOR: SOFTEON
he |
|
|
| |
|
|
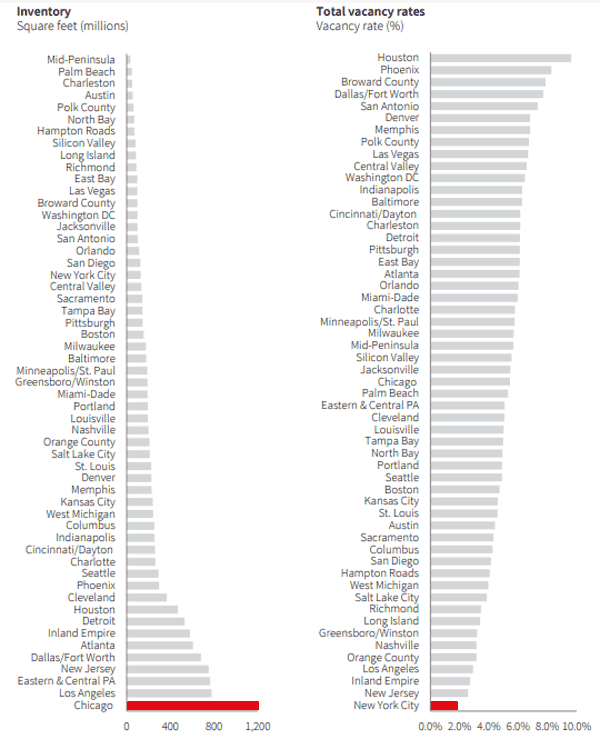
The next chart lists how much total warehouse space “inventory” different markets have, as well as the vacancy rates from highest (Houston) to lowest (New York City area). On the inventory front, Chicago maintains its sizable lead over number 2 Los Angeles, though nearby Inland Empire is not included in LA’s number:

Source: JLL
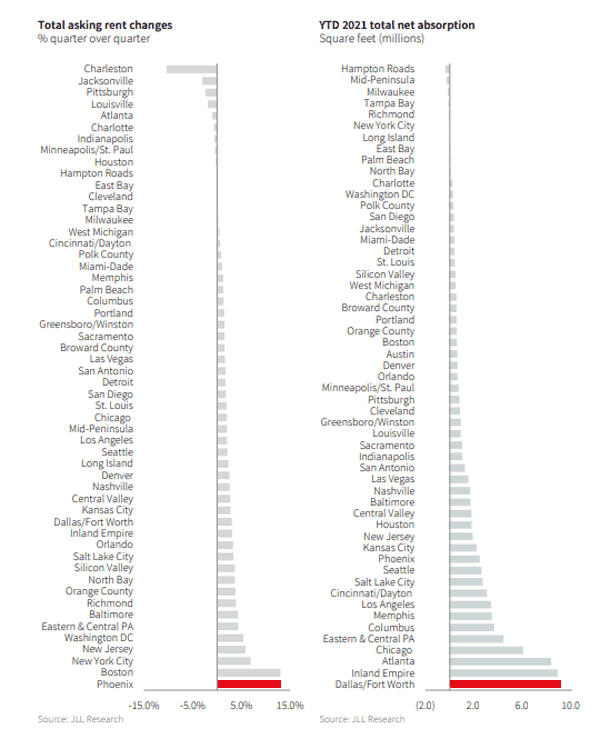
Finally, in our last chart, JLL lists lease rate changes in Q1 by major metro market (they have jumped the most in Phoenix), and where the most space has been taken so far in 2021 (Dallas leads the way).

Source: JLL
Full report is available here: JLL Q1 Industrial Outlook
Any reaction to the JLL Q1 data? Let us know your thoughts at the Feedback section below.
|