Donald Trump rode a promise of reviving US manufacturing into the oval office.
Therefore, as we begin year 1 of a Trump administration, it would seem logical to do a level set on the state of manufacturing in the US in 2017 - and the picture revealed is a bit muddled.
Supply Chain Digest Says... |
|
|
SCDigest follows closely the monthly index of manufacturing output produced by the Federal Reserve Bank - and there is an interesting story there indeed.
In 2014, we reported that at long last, US manufacturing output had finally again reached levels of the previous peak and baseline year of 2007, when the output index from the Federal Reserve climbed back to the 100 level in July of that year and stayed there for many months.
However, after a revision to the data in 2015 and a switch to 2012 as the baseline year, that milestone evaporated, and US manufacturing production late in 2015 was now shown to be below 2007 levels some eight years later. In December of 2015, the Fed index was 106.2, versus 108.3 in December of 2007, a deficit of about 2 percentage points.
That score also meant that US production at the time was up about six percent over the average month in 2012, for a gain of roughly 2 percent annually from 2012 to 2015.
But then in April of 2016, a major revision of the data pushed that trend line way down. Since then, scores are now centered around 103, not 106 - a decline of about 3 percentage points. For example, the December 2016 score came in at 103.2, about where it has been for more than a year, with little or no recent growth.
But more importantly, this means the new data shows that production since 2012 is up only about 3%, not the 6% reported before the data revision. That means annual growth of less than 1% since 2012 - and about half of what had been reported before the data revision.
An interactive chart of US manufacturing output is shown below:
Two things should stand out: (1) growth in US manufacturing output has extremely flatlined in recent years; and (2) current output is now well below the 2007 levels, now almost a decade later.
But there is conflicting data. A different measure of US manufacturing output from the Bureau of Labor Statistics shows the US did reach the pre-recession peak in 2014 - just as the Federal Reserve data originally did - but is in agreement with the Fed measure that there has been very little growth since then.
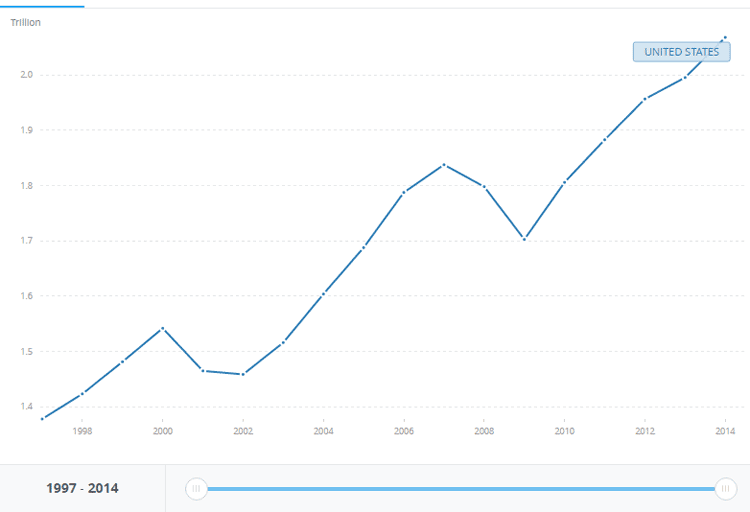
Then there is this view of so-called "manufacturing value-added," as compiled by the World Bank. It shows by that measure that US value-add has risen consistently and steadily with the exception of the recession years of 2008-09, and has increeased from $1.83 trillion in 2007 to $2.07 trillion in 2014, the last year for which data is available.
US Manufacturing Value-Added 1997-2014

Source: World Bank
That indicates growth about 12.5% over seven years - not great, but a better picture than the Federal Reserve Data paints.
SCDigest is unable to pinpoint the reason for the discrepancy.
However, that seeming bit of good news is counterweighed by the fact that a recent report from the Congressional Research Service found that America's share of global manufacturing value added fell 12 percentage points between 1993 and 2014. In other words, while US value-add has been up modestly since 2017, it is not growing as fast as it is in other countries combined, notably of course China.
(Article Continued Below)
|
CATEGORY SPONSOR: SOFTEON |
|
|
| |
|
|
What about US manufacturing employment? First, we should clarify what that data really means. Manufacturing employees are defined as those that work in a facility that is categorized by a company itself as a manufacturing plant.
It therefore counts all workers, from the plant manager (assuming his/her office is in the facility) to shop floor workers as manufacturing employees, but the preponderance are blue collar jobs.
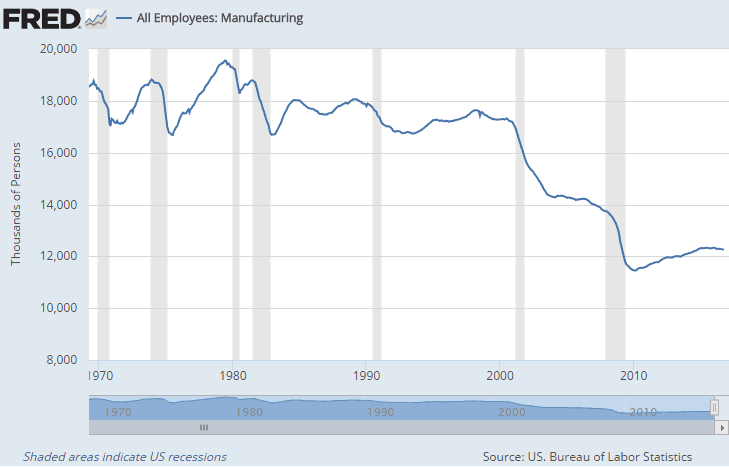
By that measure, as can be seen in the chart below, there are roughly 12.3 million US manufacturing jobs. That is up just a bit from the 11.5 million seen at the bottom in late 2009, but down substantially from the more than 17 million manufacturing jobs in 2000.
US Manufacturing Employment

There are mixed opinions as to the cause of this decline, though most pundits put the blame on factory automation more than offshoring. Still, it seems unlikely that it is a a complete coincidence that the steep fall in US manufacturing jobs - and the surge in the US trade deficit in goods with China to now more than $350 billion annually - began at the same time that China was admitted to the World Trade Organization in 2001 and offshoring become common.
As one final note, the number of US factories at the end of 2015 - the last year for which the Bureau of Labor Statistics has data - stood at just over 340,000. That number has been rising very slightly - just a thousand or so per year - since 2013. But it is down from the 363,000 factories the US had in 2006.
So, there is a snapshot of US manufacturing today, from several angles. Can Trump really reverse the long term trends? That will be a tough act indeed.
Any of this manufacturing data surprise you? What is your take on the state of US manufacturing? Let us know your thoughts at the Feedback section below.
Your Comments/Feedback
|
|
Lee Hales
President, Richard Muther & Associates |
Posted on: Feb, 08 2017 |
|
| One man's opinion and observations: 1. Such statistics are becoming politicized and thus less reliable and perhaps more subject to revision. 2. The pundits are late to the party. Bowling Green study not withstanding, robots and factory automation do not explain long-term job loss in the manufacturing sector. True, robots and automatic guided vehicles are becoming more common, but I don't count too many of them running inside empty and declining factories that once employed so many. And if robots and automation explained the loss of millions of jobs, we would have the world's largest installed base, which we do not. And European, Japanese and now Chinese companies would not be the dominant suppliers of robotics, automated material handling and other forms of automation. We would still be leaders in CNC machines. Etc. We might even be making apparel. Factory automation does not explain our loss of entire sectors and loss of leadership in factory automation, itself. |
|
|