 |
June 6, 2013 - Supply Chain Newsletter |
 |
| FEATURED SPONSOR: LOGILITY |
 |
Download this White Paper Outlines a Five-Step Approach for Optimizing the Core Tasks and Analyses that Drive S&OP Results |
 |
|
||||||||||||||||||||||||||||||||||||||||||||||||||||||||||||||||||||||||
Supply Chain Future - A Physical Internet?
|
|||||||||||||||||||||||||||||||||||||||||||||||||||||||||||||||||||||||||


| GILMORE SAYS: |
The research found that a dedicated truckload moving from Quebec to Los Angeles would require a total transit time of 124 hours. Using the relay method, and an amazing 17 trucks, that time would be reduced to just 74 hours. WHAT DO YOU SAY? |
For this specific physical internet project, the Center received a grant from the NSF and sponsorship from a number of companies, including Walmart, Walgreen's, Procter & Gamble, RedPrairie (now JDA), JB Hunt, Boeing and more.
The final phase I report was written by Russell Meller of the University of Arkansas, Kimberly Ellis of Virginia Tech and Bill Loftis of Tompkins International (I've known Loftis for a long while). The document is long and a little tough to wade through, but as opposed to some academic research it is clear the authors understand how logistics really works. And as we frequently do, I hope to summarize that full document in a way that makes sense here.
I will say it this way: the goal of the physical internet initiative is to improve logistics performance in terms costs and service. It believes this can be done by improving "horizontal" collaboration - that is, collaboration across players in the same echelon of the supply chain - perhaps competitors - by in part sharing logistics/transportation resources. At the same time, such an approach can also go a long way to meeting the Global Logistics Sustainability Grand Challenge, the title of an academic article in 2011 that also talks about the physical internet.
Now, the potential for logistics collaboration is nothing new. The concept and potential benefits have been well understood for years. Anecdotally, the level of such collaboration has recently seemed to have increased, driven primarily by Green imperatives. But, there are barriers, and the practice is still minimal. What this research is trying to do is to better quantify a wide ranges of benefits from such collaboration, and then take the idea even further by some fairly radical concepts around how to better modularize and integrate the supply chain.
That is where the "internet" part of the thinking comes. The internet works with amazing speed and efficiency because of modularization and standardization. Information to be transmitted is nicely organized into small packets. A protocol (TCP/IP) understands those packets, and the collective network in turn understands how to route those packets based on the destination (IP address).
So, could that same concept work for physical logistics items as well, such as a pallet? Yes, the report says. I will come back to that in a second.
The report notes the many issues and opportunities. Thinking from a dedicated network perspective, as nearly every shipper does, inherently means you are stuck in some kind of a trade-off curve between cost and service, as you will find in most supply chain textbooks. In addition, we still are in general not using many of our logistics assets very effectively. The project's research indicates that in total truck trailers operate at only about a 50% utilization rate, when you combine the percent of trailers that are not maxed out in terms of weight and cube with the percent of deadhead miles (about 15%).
The report asks: "Why not transform our transportation system to allow us to fully utilize our logistics resources? Such a system would have significant economic, environmental and social implications."
So again this part of the concept is not really new. It involves shippers not having dedicated logistics all the way to the final customer, but rather shipping to an intermediate facility in local markets, which would in term ship freight from multiple companies to the final destinations.
Now, there is such a pilot going on in the consumer goods industry right now in Europe. In the US, we have the ES3 facilities that are essentially performing this role, maybe others. In the mid-1990s, Hau Lee of Stanford and others had the concept of Non-Stop Logistics, where consumer goods manufacturers would ship to a facility in local market, which would then distribute to meet local retail demand, though the focus there was more on inventory rather than transportation (the idea may have been ahead of its time).
But next is where the research brings some new thinking.
One goal, the report says, is to reduce the economic order quantity from a truckload, which it generally is today, to just a single pallet.
By having intermediate facilities closer to customers, and lower EOQ ordering thresholds, normal demand will become more stable (promotional demand may still move directly from manufacturer to retail DC), meaning the Bullwhip Effect will be tamed. This will help negate the additional inventory that would normally be associated with having more local stocking locations.
Additionally, the reduced variability would enable more shippers to use intermodal (rail) service to those local markets, which will reduce transportation costs and reduce greenhouse gas emissions.
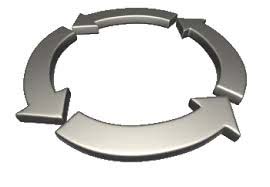
Now here is where the thinking goes really out of the box. Even for long haul moves by truck, the idea is that rather than a single driver and truck, the goods would be moved by a series of short relays, as shown in the graphic below.
When I first saw this, my initial reaction was "the cost of all this handling and trucks would be huge."
But perhaps not so. Given Hours of Service and other constrains, the research found that a dedicated truckload moving from Quebec to Los Angeles would require a total transit time of 124 hours. Using the relay method, and an amazing 17 trucks, that time would be reduced to just 74 hours - two full days faster.
And guess what happens as truckload freight transportation moves to shorter hauls? Drivers get home most nights. Quality of life improves. And the permanent problem of drivers shortages in the industry gets dramatically better.
So how could such networks possibly transfer all that freight efficiently? Ah, back to the internet parallel. The industry must adopt standardize containers and platforms, as shown in the graphic here. That would mean carriers/3PLs could plan and optimize handling and loads consistently, well in advance, without worrying what was inside or how a given shipper builds it pallets or sizes its cartons. And by the way, these containers will also be smart.
Those containers would then be routed through the networks just like internet packets are, based on their final destination (just as they are say in the UPS network today). And carriers/3PLs would bid on moving those containers as a "black box" over the web. Put those last couple of concepts together, and you have the physical supply chain internet.
I am almost out of space and not finished, so I promise to revisit this soon.
The report containers several business cases done based on modeling of real data from shippers, carriers, and retailers. There is one each for consumer goods, retail, carriers/3PLs, and general manufacturing (yes, you were not left out).
So here is what the modeling says for consumer goods manufacturers: lead times drop from 2.5 days to one day; fill rates rise from 94% to 99%; on-time delivery improves from 92% to 98%; cost per mile drop from $1.82 to $1.62 - you get the idea.
Interesting for sure, but can any of this really happen? We'll have to save that for next time. Would love to hear your opinion
What is your reaction to the physical internet vision? Real promise, or pipe dream? What more would you like to know? Let us know your thoughts at the Feedback button below.
![]()
| View Web/Printable Version of this Page |
|
|
|


YOUR FEEDBACK
Some more good emails this week, including our Feedback from Dr. Bill Hardgrave, on our On-Target piece on Is RFID Still a Disruptive Technology?
We also include another email on our A Unified Theory of Out-of-Stocks that is long but excellent, so we'll leave it at just two letters this week.
Feedback of the Week - On Is RFID Still Disruptive:
To put my comments in context, I talked about how we could and should view RFID. Bottom line: RFID can be used as an incremental, radical, and disruptive technology - it all depends on the needs of the adopter and their innovation/ risk culture. In particular, when I said "One of the problems with RFID is that it was initially used in a supply chain setting, but didn't have that great impact because retail supply chains were already pretty efficient" the context was "people were expecting radical or disruptive transformation, but deployed it incrementally." Thus, a disconnect between expectations and actual use. This led many to view the early efforts as 'failures'. I was referring to the Walmart project. I think most expected an amazing transformation, but it was deployed as a 'super barcode' which is incremental. When we found some improvement for single use cases, while good, it was disappointing to many.
And, as you noted, now that RFID is being used at the item level in the store - incremental by some, radical by a few, and too soon to be determined disruptively - it must be pushed up the supply chain to be completely effective. However, expectations are now better aligned with the way it is being deployed. For truly disruptive technologies, it may take many years to transform an industry, although some are disruptive in a short time frame. Think of barcodes as disruptive - it changed retail but took many years. I think RFID will take some time, but not as long as barcodes. Bill Hardgrave
|
||
| On Unified Theory of Out-of-Stocks: | ||
WOW! A lot to comment on in this issue. Well, first a few comments on observing out of stocks and over stocks in stores and then move to the meat — inventory balance. Observations: One national chain that I frequent periodically has little clips that they put on there pegs to hold the product forward. It is not unusual to have only one or two items on a peg. Any demand on the product will empty the peg. Your example of 75% empty pegs might be an understatement. In many companies, the recovery people are trained to "face-over" out of stock shelf space with existing product so it looks full. Unless you are knowledgable about the shelf layout, you will never notice. Even if the product is available in the back room, the stock crew and miss and important visual clue that an item need to restocked and so it sits unavailable to customers. That takes us to another key item, "dwell time". How long does the product sit before it makes its way to the shelf. Is it hours, days, weeks or even months. I'm aware of situations where seasonable merchandise was received in October, could not be worked and was put in offsite storage and was still there in February. Other stores top-stock overflow products. Look up and you will see a lot of product. How long will to take to move out the door? This could be serious overstock. Often our inventory systems, particularly in retail, are inadequate to identify where product is in the store. They show inventory only at the store level regardless of whether the product is on the shelf, in the back room or in some offsite location. Shifting gears, inventory balance is about insuring that we minimize out of stocks and control overstocks. By and large our reporting systems do not give us adequate tools to affect this. We tend to aggregate inventory and demand and high levels and report by value. When we do that, the tendency is to offset demand value against inventory value. Days of supply in inventory (DSOH) is an example of this. If we have DSOH of 30, what does that really mean? Early in my career, I managed a DC for a leading international consumer products company. There were times when the DC was so full we had to work hard to find space to put product away. Even though we had state of the art systems for that time, orders to customers were going out the door with serious shortages. To get a handle on this, I invented the technique of "Inventory Snapshots". Inventory snapshots provide a graphic view of the inventory on-hand against the projected short-term demand. The calculations are done at the SKU level with new measures: Filled from inventory (How well can the demand be filled from existing inventory) and Utilization (How well is the inventory utilized when the demand is filled). These calculations can then be aggregated at any level desired (store, product line, etc) and a graphic picture presented to give a "snapshot of the inventory position". Going back to DSOH, if we have DSOH of 30, Using the snapshot approach we could have a FILL % of 100 and a UTILization % of 100. The inventory would be perfectly balanced. On the other extreme, we could have a FILL % of 0 and a UTIL % of 0. The inventory would be totally out of balance yet we would still have DSOH of 30. For examples, see http://www.inventorycurve.com/Inventory_Snapshots.html.
Shapshots provide a tool to better see in-stock and out-of-stock positions. With that information, you have the opportunity to adjust planning parameters and execution processes to better balance inventories. David J. Armstrong, Principal
|
||
SUPPLY CHAIN TRIVIA ANSWER
Q: What is the average age for ocean container ships that are scrapped?
A: Typically about 25-30 years old, but it is just 22 years so far in 2013, according to Alphaliner, as this year should set a record for most TEU scrapped at 450,000 globally.
| © SupplyChainDigest™ 2003-2013. All Rights Reserved. SupplyChainDigest PO Box 714 Springboro, Ohio 45066 |
POWERED BY: XDIMENSION
|