Search By Topic The Green Supply Chain Distribution Digest
Supply Chain Digest Logo

Supply Chain News

Supply Chain Graphic of the Week: A Look at US Truckload Rates since 2010


Rates have been Down Each Month since early 2022


Feb. 23, 2024


We enjoy the Cass Freight Report from Cass Information Systems and partner Tim Denoyer of ACT Research, which is based on data from the billions of dollars of freight bills that Cass pays for its shipper clients.


We are also sure to take a look at the the Cass Linehaul Index within that report, which measures US per mile truckload rates before fuel surcharge and other accessorials. See chart below that tracks the index since the baselne month of January 2010, when the index = 100.


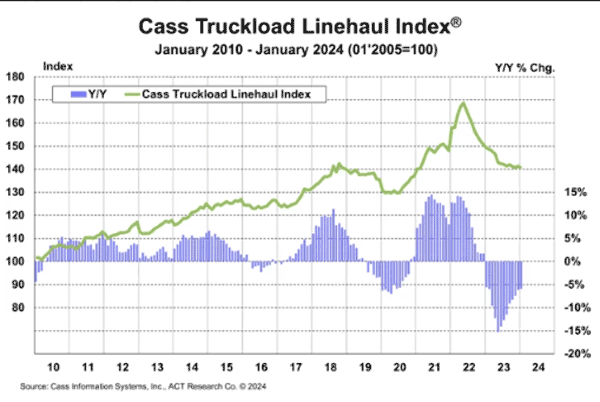
As can be seen, rates have been falling since early 2022, thoughly flatening a little in recent months.


Still, at an index value of 140 in January, it means US truckload rates are up 40% from the baseline month now 14 years later, or about 2.4% annually.


Any Feedback on our Supply Chain Graphic of the Week? Let us know your thoughts at the Feedback section below.


  m

Features

Resources

Follow Us

Supply Chain Digest news is available via RSS
RSS facebook twitter youtube
bloglines my yahoo
news gator

Newsletter

Subscribe to our insightful weekly newsletter. Get immediate access to premium contents. Its's easy and free
Enter your email below to subscribe:
submit
Join the thousands of supply chain, logistics, technology and marketing professionals who rely on Supply Chain Digest for the best in insight, news, tools, opinion, education and solution.
 
Home | Subscribe | Advertise | Contact Us | Sitemap | Privacy Policy
© Supply Chain Digest 2006-2023 - All rights reserved
.