Last week SCDigest editor Dan Gilmore wrote his column with a take on the always interesting Statistical Review of World for 2024.
Released each year in late June, the Review is a sort of almanac of all matter of energy related data.
After producing the Review for 70 years, last BP turned the work over to something called the Energy Institute.
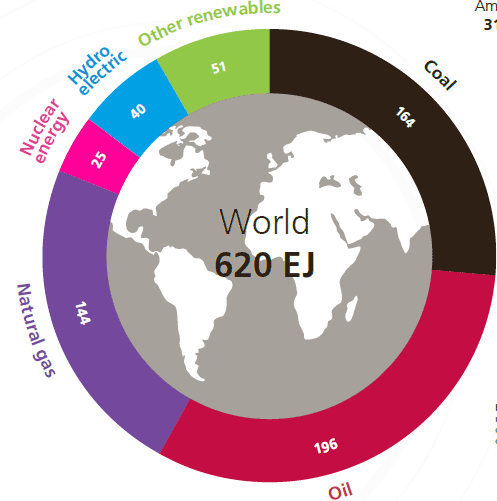
The report includes the chart below, a 2023 snap shot of energy consumption by source, as measured in “exajoules,” (EJs), an energy measure. In 2023, the world consumed 620 EJs.
The share those 620 total EJs by energy source is shown below in a graphic below from the report:
2023 Global Energy Consumption by Source

Source: Energy Institute
Using the data from the report, we did the simple math to convert the EJs to a percentage:
Oil – 31.6%
Coal – 26.4$
Natural gas – 23.2%
Renewables non-hydro – 8.2%
Nuclear – 4.0%
Now you know
Any Feedback on our Supply Chain Graphic of the Week? Let us know your thoughts at the Feedback section below.
Your Comments/Feedback
|