SCDigest periodically looks at a key macroeconomic metric called the Inventory to Sales Ratio, as produced by the US Census Bureau. The ITS measures how many month's how inventory a company has in sales.
It is calculated on a macro level by taking national business inventory levels divided by a month's worth of business sales. So, if the ITS measured 1.5, it would mean companies on average across the economy had inventory levels equal to 1.5 month's worth of sales.
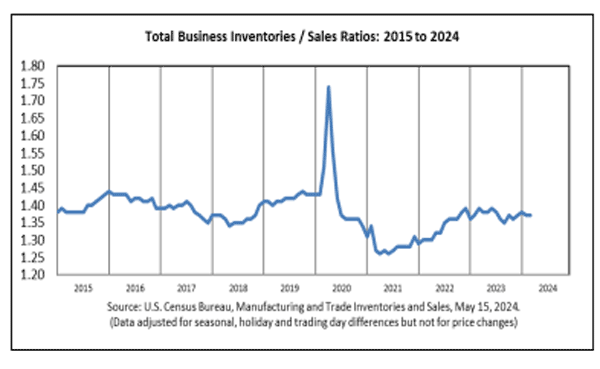
The most recent data is from March, with the chart below from the Census Bureau data:

As can be seen, inventory levels were flattish from 2014 to the start of 2020, where they briedly soared with the start of the pandemic and the resulting decline in sales.
But the ITS started falling after that, in part due to supply chain delays and disruptions that kept inventories low for many companies.
ITS then bottomed out in mid-2021, rising until Q1 2023, from which the ITF has fallen modestly before rising a bit through January.
The January number came in at 1.39 - about where the ITS was in 2005, as with the pandemic exception the ITS has come in within a fairly narrow band for more than a decade.
Any Feedback on our Supply Chain raphic of the Week? What do you think of this contributor list? Ldet us know your thoughts at the Feedback section below.
Your Comments/Feedback
|