We live in an era of real-time dashboards, but the core KPIs manufacturers have held pretty steady.
That is one of the takeaways from a survey conducted earlier this year by the Manufacturing Alliance, a research organization
Supply Chain Digest Says...
|
 |
At the site level, there are over 60 metrics (out of 96) that are tracked by at least half the respondents. The top 15 are tracked by over 85% of the companies..
|
 |
What do you say? |
| Click here to send us your comments |
 |
| |
|
That said, the Manufacturing Alliance survey found a lot of variability in how manufacturers manage KPIs. For example, the number of KPIs companies tracked range from an incredibly low one to an what would seem an unwieldy 85.
Overall, however, the research found that most companies are heavily reliant on key 5-15 key metrics.
Of course, the metrics that matter also depend on the context of their reporting.
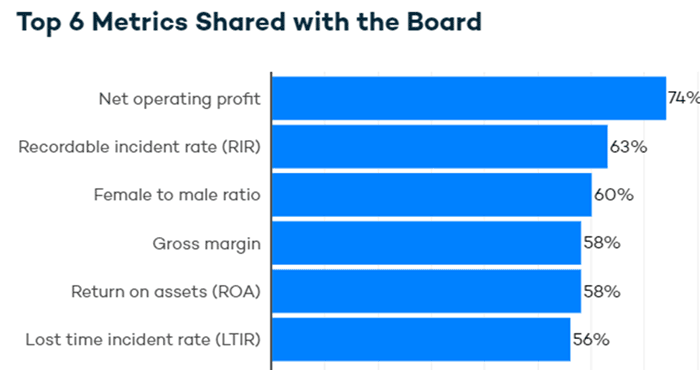
For example, KPIs shared with the board usually includes 5 or 6 key numbers, thought the research found some respondents include up to 30 high-level business performance and financial KPIs even at the board level.
At the line/cell level, KPIs are often focused on specific production metrics. At a site level, KPIs may include safety, efficiency, quality, on-time delivery, and financial metrics.
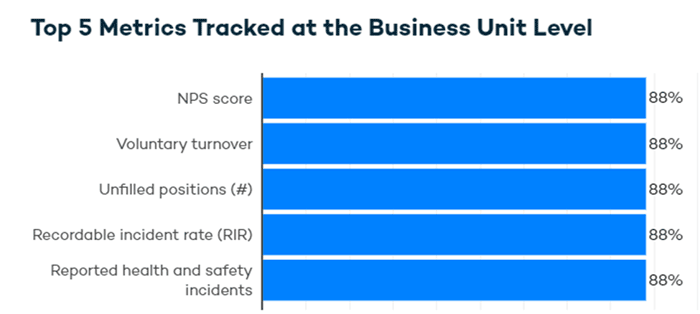
The focus at the business unit level is often on overall cost, gross margin, labor turnover, and growth, the Manufacturing Alliance adds, while at the corporate level, organizations tend to emphasize gross margins, efficiency, revenue, profitability, and financial indicators. (See charts below from the report.
Key findings in the report include:
• 11 of the top 13 metrics tracked at the line level are production metrics. The most prevalent metrics are around production downtime, cycle time, yield, and production volume.
• At the shift level, only 7 metrics are tracked by at least half of the respondents. Labor hours, production volume, and production downtime are the most tracked.
• At the site level, there are over 60 metrics (out of 96) that are tracked by at least half the respondents. The top 15 are tracked by over 85% of the companies. Labor and compliance KPIs are the top metrics being tracked. Production costs and water consumption also stand out.
• BU level - Not only does the NPS score make its debut as a top metric, but it is the top metric, with 88% of companies tracking it at the BU level. Overall, labor and profitability KPIs become top metrics at the BU level.
• KPIs related to labor and shop floor incidents are the most tracked across the board at the corporate level. On-time delivery is the most commonly tracked customer service KPI at 53%.
• Net operating profit is by far the most common KPI shared with the board. There is a much wider spread of KPIs shared at this level versus throughout the rest of the organization.
(See More Below)
The report includes some interesting charts on the use of metrics. Below we include a couple of them:

Source: Manufacturing Alliance

Source: Manufacturing Alliance
The full report is available for Manufacturing Alliance members here: What Metrics Are Manufacturers Tracking and Sharing?
Any thoughts on this story? Let us know your thoughts at the Feedback section below.
|