A key financial metric in all modes of the freight transport sector is the operating ratio.
It’s simple to calculate. Take operating costs divided by operating revenues.
So a company with $7.5 million in operating costs and $10 million in operating revenue would have an operating ratio of 75%.
As should be clear, a lower OR is better.
Why this metric became so key to evaluating the performance of freight carriers and not so much other industries is not clear.
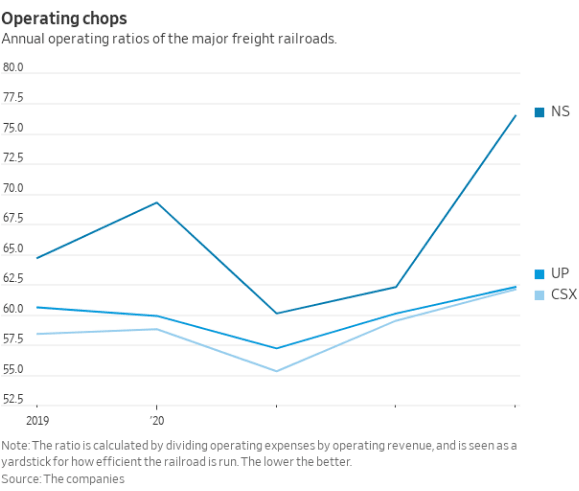
All of which is a lead into the graphic below from the Wall Street Journal this week, looking at the three main publicly traded US rail carriers: Union Pacific (UP), CSX, and Norfolk Southern (NSC).

Source: Wall Street Journal
As can be seen, the OR for all three carriers began to rise after 2021, starting at just a bit above 55% for UP and CSX and slightly higher for NSC. But the measure really took off in 2022 for NSC, rising to 75% at the end of last year, versus about 62.5% for the other two carriers.
NSC’s weak financial results have spurred a move by activist investment firm Ancora Holdings, which is seeking to oust current leadership at the carrier.
The lesson: let operating ratios rise to your peril.
Any Feedback on our Supply Chain Graphic of the Week? Let us know your thoughts at the Feedback section below.
|