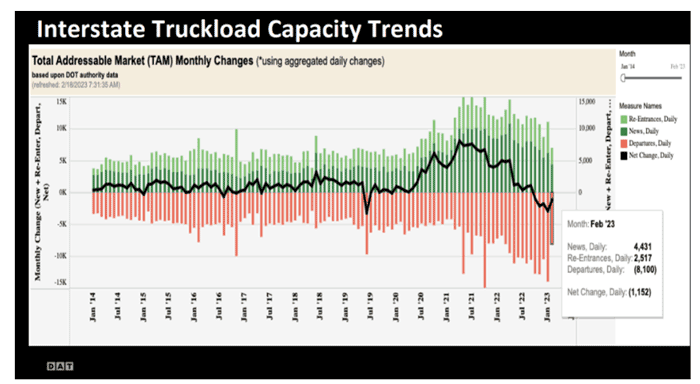
The trucking sector is correctly often seen as a harbinger of the broader economy. That intro as we take a look at an interesting but hard to decipher chart from spot market load site DAT Solutions that looks at US truckload capacity, as measured by filing carriers make to the Federal government on how many trucks they they operate. (We think.)
Capacity changes are calculated by how many enter or re-enter the market against the number of depatues.

The key data is the dark green line,which since about mid-2022 has first seen decelerating growth for many months, before moving declining capacity in the past few months.
Cass Information Systems notes in its most recent Freight Report that "In the spot market, capacity has already started to contract as carrier failures have accelerated."
Any reaction to our Supply Chain Graphic of the Week? Let us know your thoughts at the Feedback button below.
Your Comments/Feedback
|