There continues to be mixed data on the state of US manufactuing. Here is another data point.
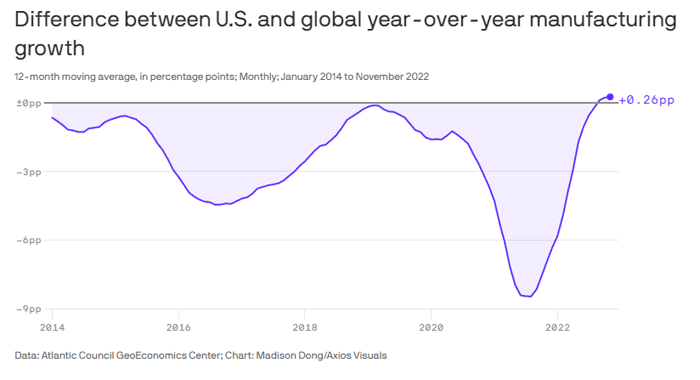
The chart below shows the difference between the US and the world's (excluding the US) industrial production by the year-over-year percent change. The Atlantic Council calculations are based on data from the Federal Reserve Bank of Dallas.

As can be seen, in late 2022, the US rose above that rest of world output.
Why? Production slow downs in China, plus strong US production of renewable energy equipment, while oil exports soared, too.
Also, domestic production of medical equipment like masks, gloves and pharmaceuticals grew nicely.
Will it last? We'll see.
Any reaction to our Supply Chain Graphic of the Week? Let us know your thoughts at the Feedback button below.
Your Comments/Feedbackc
|