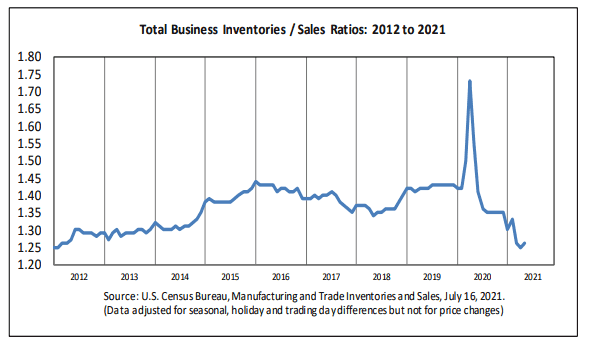
The best measure of inventory management across US supply chains is the monthly inventory-to-sales ratio from the Census Bureau.
The ITS is calulated by dividing total business inventories in the US by the applicable month's sales or revenue. In effect the measure tracks how many "sales months" of inventory businesses have on average.
The ITS data for May was just released by the Bureau last week, and while the level ticked up just a bit to 1.26, as can be seen in the chart below, the ITS spiked at the start of the pandemic - because for a few months as US sales tanked. But after that it's been down, down, down.

Source: Census Bureau
The ITS specific to retailers is even lower than for all businesses, down to just 1.07 in May, meaning retailers barerly held one month's worth if inventory.
The key question: is the falling ITS the result of savvy inventory managemnt? Or mostly due to inconsistent supply levels which are often failing to keep up with demand?
We vote for the latter.
Any reaction to our Supply Chain Graphic of the Week? Let us know your thoughts at the Feedback button below.
Your Comments/Feedback
|