SCDigest periodically looks at a key macroeconomic metric called the Inventory to Sales Ratio, as produced by the US Census Bureau. The ITS measures how many month's how inventory a company has in sales.
It is calculated on a macro level by taking national business inventory levels divided by a month's worth of business sales. So, if the ITS measured 1.5, it would mean companies on average across the economy had inventory levels equal to 1.5 month's worth of sales.
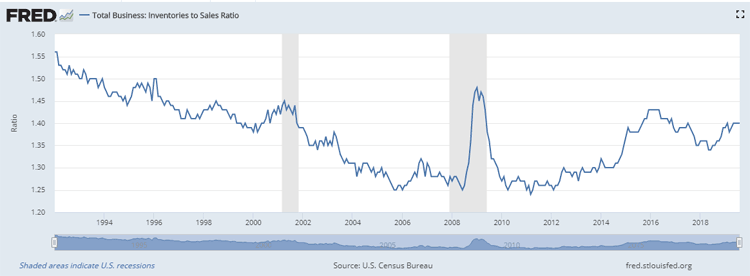
The most recent data is from August, with the chart below from the Federal Reserve Bank of St.Louis showing the metric over the last 25 years.

As can be seen, a long term trend of falling inventory levels was briefly interrupted by the great recession, when companies got caught by sudden big drop in demand. But inventory fell back to pre-recession levels and stayed there for a couple of years, only to rise from 2014 through 2016.
More recently, the ITS ratio has been flatish, with a year and a half fall followed by a six-month rise, perhaps triggered by US companies bringing in goods avoid looming tariffs on Chinese goods.
The July and August numbers both came in a 1.40 - where the ITS was in about 2003.
Any Feedback on our Supply Chain raphic of the Week? What do you think of this contributor list? Let us know your thoughts at the Feedback section below.
Your Comments/Feedback
|