Our TheGreenSupplyChain.com published a summary of the annual Statistical Review of World for Energy 2018 from BP. The review is a sort of almanac of all matter of energy related data, now in its 67th year, and as always it is quite an interesting and educational read.
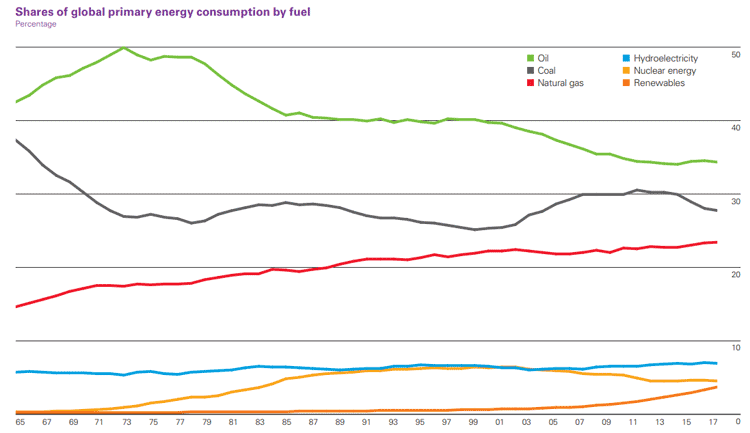
From that report comes the chart you see below, which tracks the sources (oil, natural gas, etc.) of energy that was consumed globally in 2017.

Source: BP
The data is quite interesting. As can be seen, oil continues to be the leading energy source, with a share of roughly 35%. But after falling for about 35 years, in the past 4 or 5 year's oil's share has stabilized.
Meanwhile, coal's share has been basically flat since the early 1970s, despite all the concern about CO2 and other emissions, and coal consumption grew in 2017 for the first time since 2013.
The share of renewables is showing strong growth in the past decade, but still represents less than 5% of total global energy consumption.
You can find the summary of the full report here: A Review of the BP Statistical Review of World Energy 2018
Any Feedback on our Supply Chain Graphic of the Week? Let us know your thoughts at the Feedback section below.
Your Comments/Feedback
a
|