The Cass Information Systems Linehaul Index measures US per mile truckload rates before fuel surcharge and other sccessorials. Given Cass pays some $25 billion annual in freight bills for clients, the data has a great deal of validity.
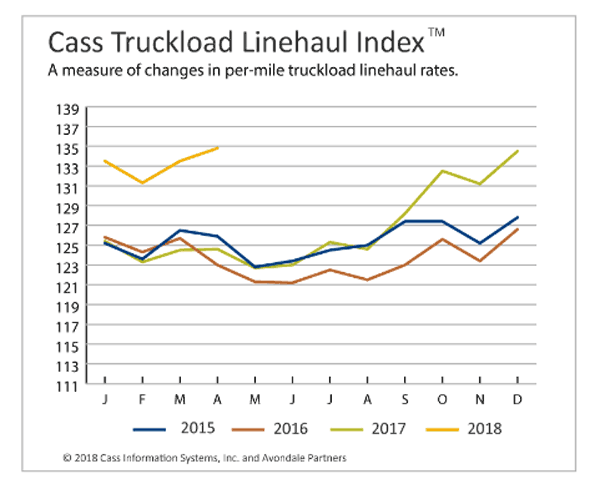
Below is the chart from the latest report, covering April. The May index should be out in about another week.

Observe how the lines for the Index from the first four month of 2015 through 2017 track rather closely together - meaning little year-over-year change.
But the index starts to take off in September of last year, a trend which has certainly continued into 2018. The first four months of the year have huge separation from previoius years, with the Index (January 2005 - 100) 8-10 points above previous year levels.
Wow. May be worth showing to executivs griping about soaring logistics costs.
Any Feedback on our Supply Chain Graphic of the Week? Let us know your thoughts at the Feedback section below.
Your Comments/Feedback
|