As usual, SCDigest has been doing some further analysis of the data in the annual working capital report from REL, a Hackett Group company, which has been made available to SCDigest for more than a decade now.
Separate from the Hackett data, SCDigest on its own analyzed US inventory performance in 2016 overall and by key sectors, in two of editor Dan Gilmore's recent First Thoughts columns (see Supply Chain Inventory Performance 2017, Supply Chain Inventory Performance 2017 Part 2).
Then this week, we took a look at trends in how long it takes companies to pay their suppliers, using the Hackett data. (See Understanding Days Payables Outstanding, and DPO Results for Select Companies.)
Hackerr/REL uses the three components of working capital - inventory, payables and receivables - to track changes over time in each area across 1000 large publicly traded companies, and then all three together to measure the "cash conversion cycle," a metric that expresses the length of time, in days, that it takes for a company to convert resource inputs into customer cash flows.
So, a lower CCC is better, as is lower DIO (Days Inventory Outstanding), which is sort of the opposite metric of inventory turns. From a company's own cash flow perspective, higher Days Payables Outstanding (DPO) is better, but of course that means a company is stretching out payables to suppliers even longer, which can have its own set of ramifications, such as perhaps higher prices.
Higher Days Sales Outstanding is not good, as it means it is taking a company longer to get paid by customers.
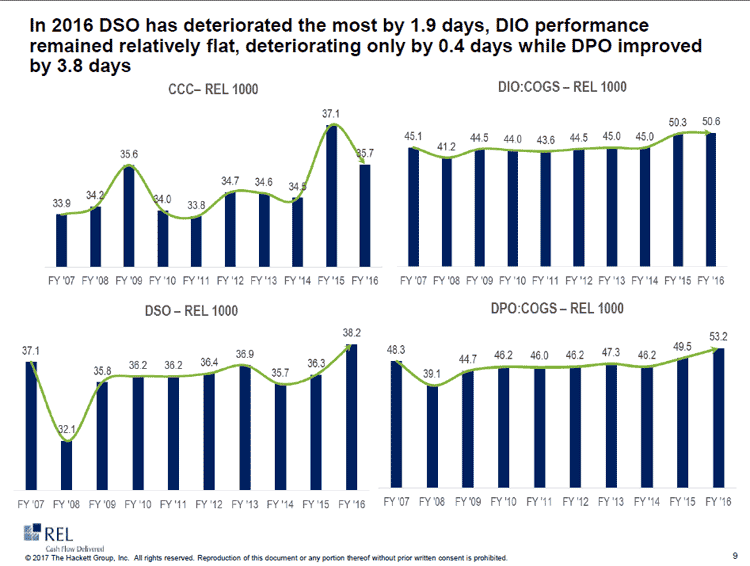
All of these measures were tracked in this year's Hackett report for the last 10 years, as shown in the graphic below:
Working Capital Component Measures 2007 to 2016

Source: Hackett/REL
So the cash-to-cash conversion cycle (CCC) fell 1.4 days (good) across companies last year, but is still a bit longer than has been generally seen in the past decade, when CCC was about 33-34 days, versus 35.7 in 2016.
Inventory performance deterioriated a bit last year, with DIO up, consistent with other measures, such as the inventory-to-sales ratio from the US Commerce Dept., that shows the same trend.
It's taking longer to get paid by customers (DSO up almost two days in 2016) - but that's should be a surprise, because companies also say they are taking longer to pay suppliers, with DPO up almost three days last year.
What goes around comes around, as they say.
So there you have it - a bit more "supply chain finance 101," as we like to say.
Any Feedback on our Supply Chain Graphic of the Week? Let us know your thoughts at the Feedback section below.
Your Comments/Feedback
|