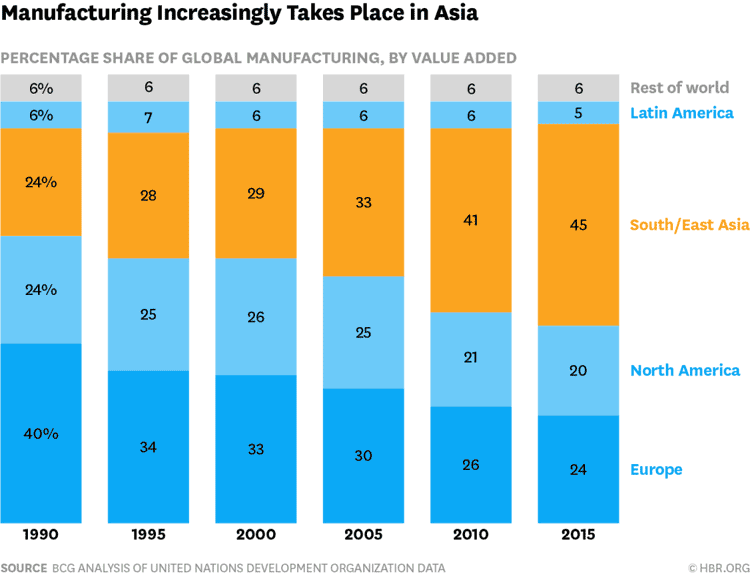
It's no secret that the share of global manufacturing achieved by Southeast Asia generally and China specifically has grown substantially over almost three decades, but it is still interesting to see that shift in graphical form.
The illustration below, from a recent article by Justin Rose and Martin Reeves of Boston Consulting Group (BCG) on the Harvard Business Review's web site, tracks the share of manufacturing "value-add" across different regions of the world in five year increments since 1990.

As can be seen, Southeast Asian countries have seen their share rise to 45% of manufacturing value-added, almost double their 24% share in 1990.
But that trend maybe changing, Rose and Reeves write.
"We've been warning for years that this shift had gone too far and had urged global companies to rethink their manufacturing and sourcing footprint," the pair say.
Why? Three key reasons:
1. Rising labor costs in Asia that erode its overall cost advantage
2. Increased use of robotics in manufacturing that reduces the need for labor
3. A shift towards protectionist moves in many Western countries
While there is clear interest in many companies to move more producton back to the US, there are many barriers, BCG says.
That includes the the decimation of the US supply base: The United States suffered a net loss of nearly 19,000 manufacturing firms between 2001 and 2015, according to US Bureau of Labor Statistics and US Census Bureau data.
So what to do? Rose and Reeves suggest these steps:
• Evaluate your existing and future customer footprint and map it against your existing manufacturing and supply chain capabilities.
• Analyze the total costs of supply for each alternative location.
• Explore advanced manufacturing technologies and possibilities, especially flexible robotics and automation, and understand how these change the equation.
• Proactively try to rebuild your atrophied supply-chain ecosystems, if possible in conjunction with similar manufacturers and large customers.
• Engineer your supply chains to be resilient to further shifts and instabilities in trade policies and exchange rates.
Any Feedback on our Supply Chain Graphic of the Week? Let us know your thoughts at the Feedback section below.
Your Comments/Feedback
|