Fairly short and sweet this week.
For those companies considering creation of a supply chain sustainability scorecard, or improvingty the one they already have, some advice from the University of Tennessee.
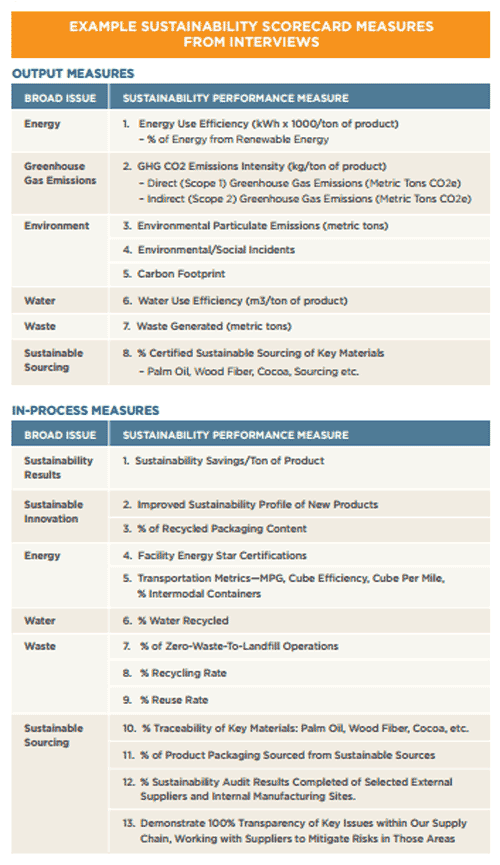
In a new white paper from the university's Haslem College of Business supply chain faculty, titled Creating a Transparent Supply Chain Best Practices, the school put together a template for such scorecard, base on interviews with 16 different companies are how they manage sustainability and transparency.
That scorecard template is shown in the table below, SCDigest's Supply Chain Graphic of the Week:

Source: University of Tennessee
Of course, there is no one size fits all. Companies likely will need to adapt this template to their specific situations. For example, the best reference point for carbon intensity may not be "tons" of product produced, as suggested here, but instead cases or units or some other measure.
Walmart, for example, regularly reports on its fuel consumed per case delivered to its DCs.
But this seems to us a reasobable place to start for those not yet doing sustainability scorecarding, or those which want to advance current efforts.
The full report is available here: Creating a Transparent Supply Chain Best Practices
Any Feedback on our Supply Chain Graphic of the Week? Let us know your thoughts at the Feedback section below.
Your Comments/Feedback
|