As usual, SCDigest has been doing some further analysis of the data in the annual working capital report from REL, a Hackett Group company, which has been made available to SCDigest for more than a decade now.
That includes last week's First Thoughts column by SCDigest editor Dan Gilmore, which looked at inventory turn performance in 2015 by various sectors (see Inventory Performance 2016), and then another piece in our OnTarget newsletter looking at trends in payables to suppliers (they are were elongated last year) - see Companies Stretched out Payments to Suppliers 5% in 2015.
REL uses the three components of working capital - inventory, payables and receivables - to track changes over time in each area across 1000 large publicly traded companies, and then all three together to measure the "cash conversion cycle," a metric that expresses the length of time, in days, that it takes for a company to convert resource inputs into cash flows.
So, a lower CCC is better, as is lower DIO (Days Inventory Outstanding), which is sort of the opposite metric of inventory turns. From a company's own cash flow perspective, higher Days Payables Outstanding (DPO) is better, but of course that means a company is stretching out payables to suppliers even longer, which can have its own set of ramifications, such as perhaps higher prices.
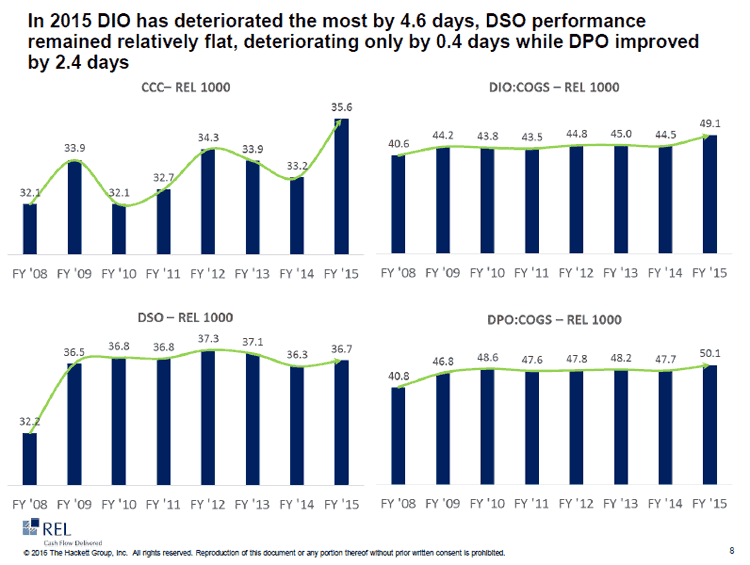
All of these measures were tracked in this year's REL report for the lat eight years, as shown in the graphic below:
Working Capital Component Measures 2008-2016

Source: REL
So, overall cash conversion cycles are up (not good) about 11% from 2010 (skipping past the recession years of 2008-09 for the comparison). Inventory performance as measured by DIO has deteriorated about 12% over the same period, to an average of 49.1 days versus 43.8 in 2010. And after staying basically flat from 2010 through 2014, companies on average did extend payments to suppliers by about 5% in 2015 over 2014.
So there you have it - a bit more "supply chain finance 101," as we like to say.
Any Feedback on our Supply Chain Graphic of the Week? Let us know your thoughts at the Feedback section below.
Your Comments/Feedback
|