For many years now I have been doing an annual analysis and comparison of Walmart and Amazon, the two most important retailers in the world.
Walmart of course deserves that place due to its stature as still the world's largest merchant-and now second largest company, and one that represents an often substantial share of many consumer goods companies' total sales.
In terms of total revenue, Walmart came in at $713.1 billion for its fiscal year ending in January, 4.7% above the $680.9 in sales the previous year, as Walmart was helped in several ways from rising inflation.
Amazon total revenue in 2025 was $716.9 billion, up 12.3% from the $638 billion in 2024. And so Amazon did indeed become the world’s largest company last year, though Walmart for now remains the largest retailer.
What Walmart and Amazon are doing is obviously of interest to most other retail and consumer goods manufacturers, and I hope others as well, as in the end almost every company is connected in the end to the retail supply chain.
So let's start with Walmart, based again on its full fiscal year ending this past January. While Walmart is an incredible giant, its growth had been slowing in recent years- until lately, during and since the pandemic.
As can be seen in the chart below, Walmart's US sales (Walmart stores only) grew very rapidly in the beginning years of the 2000s, primarily by adding new superstores carrying groceries at a rapid pace into new markets.
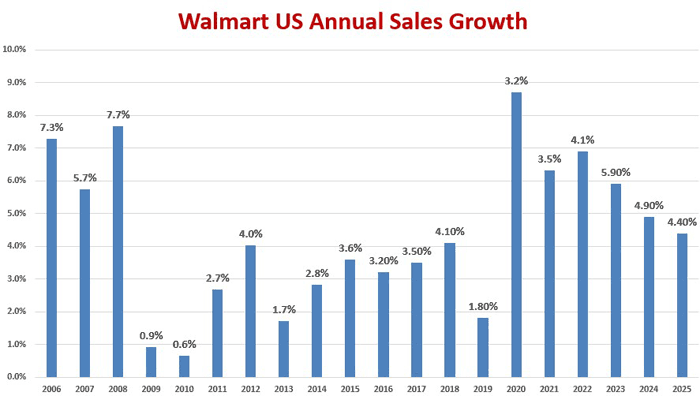
But that growth soon decelerated, and in the recession year of 2009 started a pattern of mostly very low growth (2012 an exception) for a few years. As can be seen, growth in 2015 to 2018 was a solid 3-4% (solid for a company that of that size that isn't Amazon).
It then jumped back up to a robust 8.7% growth in 2020 in the stay at home economy, but then also saw growth in a strong 5-6% range since then, before dropping to 4.4% last year.
Gilmore Says.... |
 |
| Not all that many years ago, there were concerns (I think legitimately at the time) about Walmart gobbling a giant, monopolistic share of the US retail market. |
 |
What do you say? |
|
| Click here to send us your comments |
| |
|
|
|
Total Walmart US sales (Walmart US + Sam's Club) reached $581 billion last year, 153.8% growth versus the $228.9 billion those two segments had in 2004, but as noted above that pace of that growth had obviously slowed substantially until the past five years. The Cumulative Average Growth Rate (CAGR) has averaged 4.54% since 2004, and now 4.5% since 2020.
Walmart's International's growth was decent last year, coming in at 7.0% growth. Walmart International sales last year were $130.4 billion, up a little from the $121.3 billion seen in 2020.They were at $125 billion all the way back in 2011. International is clearly not the Walmart growth engine once imagined and is now something of a boat anchor for financial performance. But maybe they have turned it around.
Not all that many years ago, there were concerns (I think legitimately at the time) about Walmart gobbling a giant, monopolistic share of the US retail market. That fear has simply faded, in the face of a generally flat Walmart share and the rise of Amazon, which is the one everyone is now worried about swallowing the world.
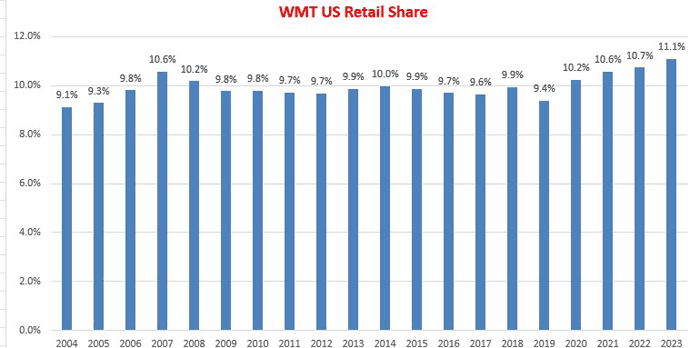
SCDigest developed a methodology several years ago, where we compare Walmart's total US store sales versus relevant US retail figures - total retail minus autos and parts, gas station and other fuel sales, and restaurants/bars.
It's not quite perfect because Walmart does sell some gasoline, but it doesn't break it out in a way we can use. Nevertheless, I think what we have is pretty good - and does reflect a higher share of US retail sales for Walmart than if you do not exclude those categories, which is how it is often reported. When you hear numbers like this, make sure you understand how they are calculated.
By our measure, as seen in the chart below, Walmart had a 11.1% share of US retail sales in 2025, just up from the previous record of 10.7% seen in 2004. I will note the government revised some of its data two years ago, so there may be some modest differences in this year’s numbers versus what I have presented in prior years (basic story is unchanged).
Amazon meanwhile saw basically flat growth on-line sales for most of 2022 and into 2023, before rallying to a big 12.3% growth in 2025, as noted above.
Still, in 2023 Amazon had 40.5% of US retail ecommerce spend compared to Walmart’s 9.2% according to estimates from the statista.com. Other sources have different numbers, but they are generally close enough to these that show Amazon's dominance.
Amazon provides a lot of numbers to analysts but getting the best insight from them takes some work. That is because of its several business units and how it computes certain ratios, and (unfortunately) changes it has made in the past few years in what numbers it provides.
Realize that of Amazon’s total sales in 2025 of $716.bllion, some 58.7% (and growing) comes from services, such as its AWS web services unit, Fulfillment by Amazon, advertising revenue, (especially) marketplace commissions and more.
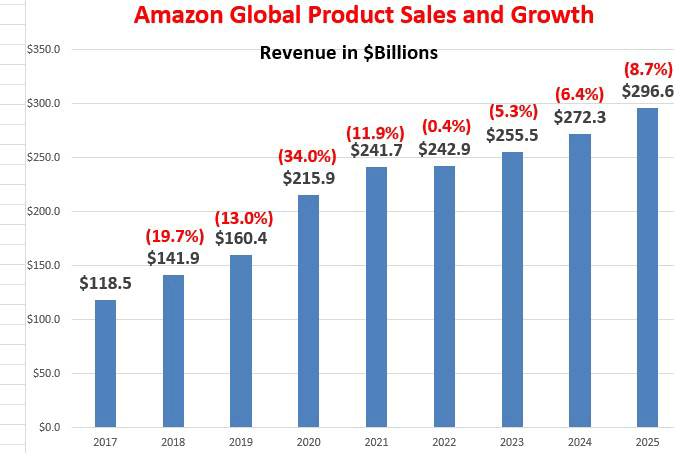
The chart below shows Amazon's recent growth in product sales on a global basis. So Amazon’s revenue growth overall was 12.3% in 2025, while product sales were up a more modest 8.7%, meaning services grew much faster.
As briefly noted above, it used to be easier to track Amazon's logistics costs, which include fulfillment (distribution center costs, including amortization of all those expensive FCs, plus some inbound transportation costs), and shipping expense, which is accounted for separately from fulfillment.
Amazon used to report net shipping expense (shipping costs minus any shipping revenues, including an allocation of Prime subscription sales), but it no longer does. That said, I am sure shipping still is a big loss leader for Amazon, almost certainly several billion dollars per year at minimum.
But as a quick calculation, Amazon spent $109.0 billion globally on fulfillment in 2025 and $102 billion on shipping, for a total logistics spend of an incredible $211 billion. That’s on $269.1 billion of on-line store sales. By my way of thinking, logistics costs as a percent of physical product sales are continuing to rise rapidly at Amazon, though at a slower pace in 2025.
I am out of room, even though I have a lot more. Will do a part 2 on this as I did last year next week.
Any reaction to these numbers from Amazon and Walmart? Any other data you would like to see? Let us know your thoughts at the Feedback button or section below.
Your Comments/Feedback
|