As part of our usual review of each half year in supply chain, I recently took a look at the top stories by month in 1H 2026 (see Top Supply Chain Stories by Month 1H 2026.) The week before that, I reviewed the performance of our supply chain and logistics stock index. (See Supply Chain Stocks 1H 2026.)
This week, we offer our popular look at the first six months of 2025 in numbers and charts.
We always start with a check on the US and global economy, as that has such an impact in the end on supply chain practice.
In Q1 we saw real GDP growth of a decent 2.1%. The first estimate of Q2 GDP will be released any day now.
Gilmore Says.... |
 Ecommerce sales were up in Q1, the most recent number we have, rising 2.7% versus Q4, 2025 and 9.8% versus Q1 2025. That left ecommerce sales as a share of total retail at 16.9%, by the way the Census Bureau measures it, up from 16.7% in Q4. Ecommerce sales were up in Q1, the most recent number we have, rising 2.7% versus Q4, 2025 and 9.8% versus Q1 2025. That left ecommerce sales as a share of total retail at 16.9%, by the way the Census Bureau measures it, up from 16.7% in Q4.
. |
What do you say? |
|
| Click here to send us your comments |
|
|
In terms of the full year, in July the International Monetary Fund (IMF) forecast US GDP at 2.1% growth for all 2026, and 2.3% for 2027.
The IMF also estimated global growth at 3.0% for this year, and 3.4% for 2027. China is estimated to grow 4.6% in the current year.
One measure of the health of the US manufacturing sector is the US Purchasing Managers Index from the Institute of Supply Management.
As shown below, the PMI was below the key 50 mark that separates US manufacturing expansion from contraction in the last six months of 2025, and indeed it has been so for 30 out of 32 months But January started a trend of six straight months above the 50 level. That put the 12-month average at 50.7.
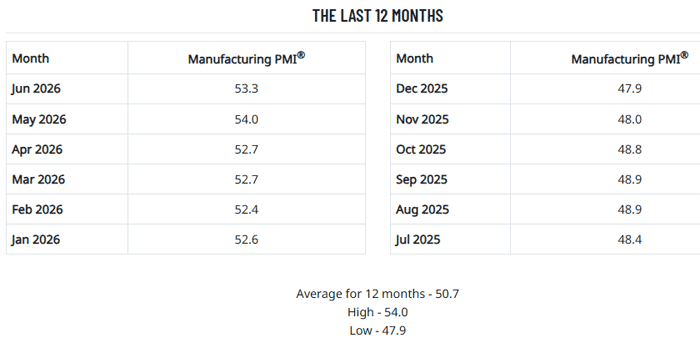
Source: ISM
So mixed signals on the economy, modestly positive Q1 GDP, then likely a somewhat better Q2, with the PMI emerging out of a prolonged manufacturing slump, with modest forecasts for full year growth.
Another view of US manufacturing strength is the index on US factory output from the Federal Reserve.
The index for June came out at 97.9, making it a number of months that the measure has come in around the 96-98 level - no real growth, but not recessionary declines either. So June output was up just 1.1% versus the same period in 2025. And at an index level of 97.9, it means US manufacturing output is below that of the baseline year of 2017 (index = 100) now nine years later. It is also well below the all-time high of about 108, reached in late 2007. The June score is also still well below the 105 level in February 2020 right before the COVID crisis.
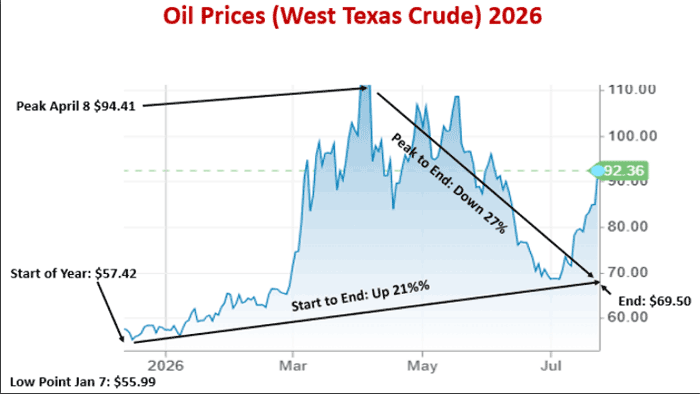
Switching gears, it was a wild six months for oil prices in the first half of the year. At the start of January crude was $57.42 per barrel, and it jumped from there to a 1H peak of $94.41 in mid-April. It stayed elevated from there until the start of June, when the price dropped on news of potential peace in the Middle East, before ending June at $69.50.That meant a rise of 21% for the 1H.
US on-the-road diesel prices followed suit, starting the year at $3.50 per gallon, and ending in June at $4.66, with a peak of $5.64 the first week of April.
Freight volumes were mixed but mostly down, as the “freight recession” continued on now for more than two years but showed signs of ending in Q2.
The Freight Tonnage Index from the ATA for June showed volumes were up 2% in the first five months of the year. The full index reading for May was just 114.4, versus the baseline of the average month in 2015 (index = 100), meaning 10 years later US freight tonnage is only up 14.4%.
It was a decent first half for US railroads. Total combined US carloads and intermodal cars were up 3.4 % to 13.1 million, as rail cars rose 3.2% to 5.6 million, with intermodal up a solid 3.6% to 7.2 million units.
Ocean container shipping rates were up in the first half, with the China Containerized Freight Index starting the year at about 1630, then rising steadily to 3060 at the end of June, for an increase of 87%.
Ecommerce sales were up in Q1, the most recent number we have, rising 2.7% versus Q4, 2025 and 9.8% versus Q1 2025. That left ecommerce sales as a share of total retail at 16.9%, by the way the Census Bureau measures it, up from 16.7% in Q4.
I have lots more but am out of space. Hope you enjoyed all this.
What is your reaction of 1H supply chain 2026 in numbers and charts? What numbers would you add? Let us know your thought at the Feedback section below.
Your Comments/Feedback
|