Gilmore Says.... |
 |
|
The US thus spent about $144 billion more on parcel shipping than it did in rail transport last year - a bit more than a delta of $132.2 billion in 2024.
 |
What do you say? |
|
| Click here to send us your comments |
| |
|
|
|
However, the consultants at Kearney took over producing the report 11 years ago, and I will say Kearney has again done a great job providing the analysis of 2025 but also bringing in more timely data and trends from the first few months of 2025 to the extent possible.
Five Kearney consultants - Michael Zimmerman, Korhan Acar, Andres Mendoza Pena, Rupal Deshmukn and Marc Palazzolo - are cited as the report's authors, with shout outs to dozens of other people and organizations that helped with data or advice.
Again this year, Penske Logistics funded the report development.
This is actually the 37th edition of the State of Logistics report, which was launched in 1988 by the late Bob Delaney and sponsored by his company, Cass Information Systems. Somewhere along the way, CSCMP took over sponsorship.
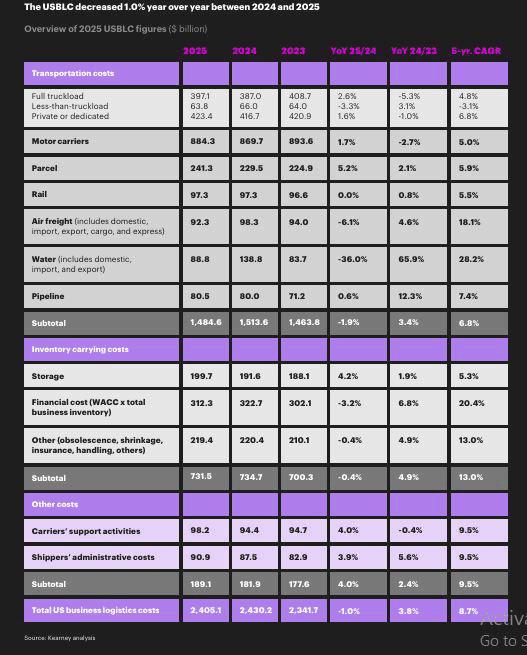
The headline news (sort of): what the report several years back started calling US Business Logistics Costs (USBLC) fell on an absolute basis in 2025 to $2.40 trillion, down from $2.43 trillion in 2024, for a decline of 1%.
Since the report's inception, total USBLC is then divided by nominal US GDP to calculate logistics costs as a percent of GDP, which can be used for comparisons across years.
I say “sort of” because again this year, for reasons unclear, the report only mentions the modest fall in USBLS briefly several pages in, providing the number as a percent of GDP only in a table in the Appendix. That shows logistics costs as a percentage of GDP fell to 7.8% in 2025, down from 8.3% in 2024 and 8.4% in 2023, all down from a recent high of 10.2% in 2022.
I next include a chart from the report that provides a breakdown of all the categories of those logistics costs:
Underneath the overall logistics cost number, transportation costs - the largest single component of USBLC at 61.8% of the total (versus 6.22% in 2024) – were about flat, versus an average of 8.7% annually over the past five years.
The second component of USBLC, inventory carrying costs (30.4% of the total, versus 30.2% in 2024), were down just a little from last year under the report's calculation, which includes the cost of warehousing and inventory levels but also the cost of capital (which drives the cost of holding inventory).
Inventories as a percent of sales were again down modestly in 2025.
"Other" costs - always somewhat vague and mostly involving certain IT expenses and some services such as freight forwarding -were flat last year, though this bucket is by far the smallest of the three main categories at just 7.8% of the total cost logistics number (versus 7.4% in 2023).
You can find the full breakdown by logistics cost bucket in the chart below:
Source: CSCMP/Kearney
Within transportation, trucking-related spend (including private fleets but excluding parcel) comprised 59.5% of total transport costs and 36.8% of total logistics spend, up from 35.7% in 2024.
Parcel shipping costs were estimated at $241.3 billion, up from $229.5 billion in 2024, as ecommerce growth was tepid, and we would assume from this number B2B parcel volumes as well. Parcel represented 16.2% of total transport costs and 10.0% of total logistics spend, about flat with 2024's 9.4%. Over the past five years, parcel costs have risen by 5.5% on average, with a slow 2023, 2034 and now 2025.
At $97.3 billion in 2025 -the same as 2024 - rail comprised just 6.5% of transportation spend, about even with 6.4% in 2024. Rail was also 4.0% of the total logistics costs, the same as in 2024.
The US thus spent about $144 billion more on parcel shipping than it did in rail transport last year - a bit more than a delta of $132.2 billion in 2024.
In terms of growth in spending by these various categories, the 5-year average annual growth rate in costs by mode or cost category are as follows, according to the report:
• Truckload: 4.8%
• LTL: -3.1%
• Private/dedicated fleet: 6.8%
• Trucking combined: 5.0%
• Parcel: 5.9%
• Rail: 5.5%
• Air freight: 18.1%
• Waterways: 28.2%
• Warehousing: 5.3%
With overall transport costs rising 6.8% per year over the past five years, comparing the rise in any specific areas versus that overall number will indicate whether a mode gaining or losing share of total spend (note: that is not the same as tonnage share changes, though I suspect the numbers would be similar).
I think I will leave it here for a part 2 next week.
CSCMP members can download a copy for no charge, and others can purchase one for a modest fee. I recommend it.
Any reaction to our summary of this year's State of Logistics Report? How could the report be improved? Let us know your thoughts at the Feedback section below.
Your Comments/Feedback
|