Each year for maybe 15 years I Iooked forward to perusing and reviewing the annual BP Statistical Review of World Energy, which was around for decades before I discovered it.
Released each year in late June, the Review is a sort of almanac of all matter of energy related data, and as always it is quite an interesting and educational read.
Except starting last year, BP turned the work over to something called the Energy Institute, and they’re back again in 2024..
Gilmore Says.... |
 |
Greenhouse gas emissions from energy use, industrial processes, flaring and methane (in carbon dioxide equivalent terms) increased 2.1% to exceed the record level set in 2022
|
 |
What do you say? |
|
| Click here to send us your comments |
| |
|
|
|
tThe report is full of information on energy production andconsumption. Energy of course is at the heart of supply chain in many ways, and central to our lives. A world of relatively cheap, abundant energy would bring prosperity and more income equality to much of the world.
High energy prices have the opposite effect, as we learned in the 1970s, again in 2008 and again in late 2021 and for much of 2022.
Energy costs can have a major impact on a variety of supply chain decisions, including network design and how to optimally navigate the tradeoff curve between inventory and transportation costs.
Let’s take a look at report highlights.
The report notes that in 2023 we saw, “Record consumption of fossil fuels and record emissions from energy, but also record generation from renewables, driven by increasingly competitive wind and solar energy.”
The headline news from this year’s report: Total primary energy consumption increased by 2% over its 2022 level, 0.6% above its ten-year average and over 5% above its 2019 pre-COVID level.
Total fossil fuel consumption came in at 81.5% of the total, still an overwhelming share, but down 0.4% from 2022.
However, renewables’ share of total primary energy consumption reached 14.6%, an increase of 0.4% over the previous year.
Together with nuclear, they represented over 18% of total primary energy consumption.
I can’ find in this year’s report the one chart that was my favorite, which showed the share of different energy sources over time.
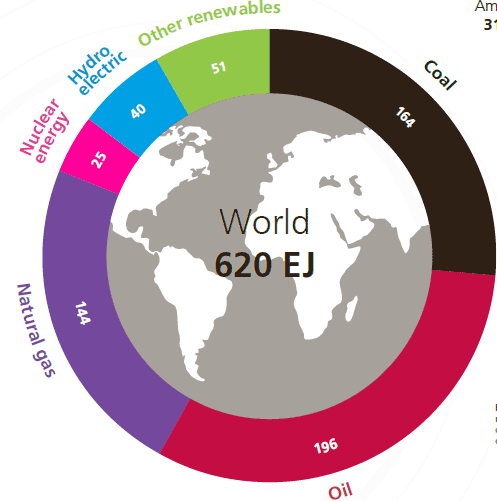
Instead we get the chart below, which is a 2023 snap shot of energy consumption by source, as measured in “exajoules,” (EJs), an energy measure. In 2023, the world consumed 620 EJs.
The share those 620 total EJs by energy source is shown below in the graphic below from the report:
2023 Global Energy Consumption by Source

Source: Energy Institute
Using the data from the report, we did the simple math to convert the EJs to a percentage.
Oil – 31.6%
Coal – 26.4$
Natural gas – 23.2%
Renewables non-hydro – 8.2%
Nuclear – 4.0%
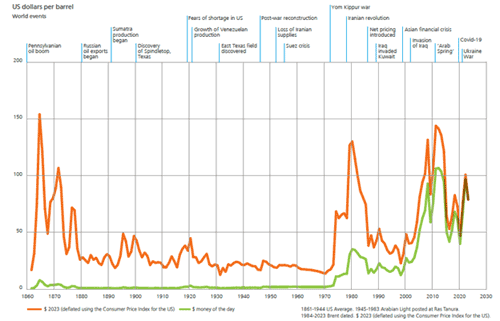
I also liked this chart, which tracks oil prices over time. The green line shows those prices in the dollars of the day. The red line shows prices in inflation-adjust terms.
Oil Prices Over Time

As can be seen, in those inflation-adjusted prices oil reached a peak in 2010, excluding a spike very early on in the 1860s. We are still at rather high levels historically.
Although Brent crude oil prices fell 18% to average $83/bbl in 2023, they were still some 29% above their 2019 pre-COVID levels.
A few other highlights from the report:
Greenhouse gas emissions from energy use, industrial processes, flaring and methane (in carbon dioxide equivalent terms) increased 2.1% to exceed the record level set in 2022. So all the efforts towards reducing emissions are simply not having much total effect.
Global oil production increased by 2.1 million b/d to reach a record level of 96 million b/d in 2023.
Despite the “war on coal,” flobal coal production reached its highest ever level (179 EJ), beating the previous high set the year before.
However, the Asia Pacific region accounted for nearly 80% of global output with activity concentrated in just four countries, Australia, China, India, and Indonesia.
Think I will end it here. The report is an interesting read, and available without registration here: Statistical Review of World Energy 2024.
Any reaction to this energy report? Let us know your thoughts at the Feedback button (email) or section below.
Your Comments/Feedback.
|