As part of our usual review of each half year in supply chain, I recently took a look at the top stories by month in 2023 (see The Top Supply Chain Stories by Month 2023.)
This week, we offer our popular look at 2023 in numbers and charts.
Gilmore Says.... |
 Ecommerce sales growth grew decently. According to data from the Census Bureau, on-line sales growth in Q1, Q2,and Q3 was 7.6%, 7.6% and 7.5%, respectively, versus 2022 Ecommerce sales growth grew decently. According to data from the Census Bureau, on-line sales growth in Q1, Q2,and Q3 was 7.6%, 7.6% and 7.5%, respectively, versus 2022
. |
What do you say? |
|
| Click here to send us your comments |
|
|
We always start with a check on the US and global economy, as that has such an impact in the end on supply chain practice.
Real US GDP was up a strong 4.9% in Q3, following 2.1% in Q2 and 2.0% in Q1. Predictions for Q4 are for 2.2% growth.
That would leave full year 2023 growth at 2.2%. The economy remains lukewarm, but the long-predicted recession never shows up.
In terms of 2024, the Federal Reserve Bank of Philadelphia's survey of professional forecasters found on average expectations for 1.7% growth.
Global GDP was up 2.6%, with forecasts for a weak 2.4% in 2024.
Global trade volumes were basically flat in 2023, according to the World Trade Organization. The WTO expects a modest uptick to 2.3% in 2024.
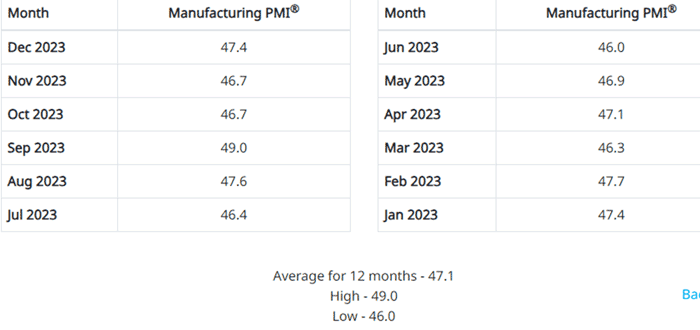
One measure of the health of the US manufacturing sector is the US Purchasing Managers Index from the Institute of Supply Management. As shown below, the PMI below the key 50 mark that separates US manufacturing expansion from contraction for each month of 2023 – not good.
US PMI Last 12 Months

Another view of US manufacturing strength is the index on US factory output from the Federal Reserve.
The index for November, the most recent we have, came out at 99.2. That was up from the 95.5 seen in January. However, the November score is still well below the 105 level in February 2020 right before the COVID crisis, and basically flat with November 2022.
In fact, at index level of 99.2, it means US manufacturing output is still below baseline 2017 levels (index = 100) now seven long years later.
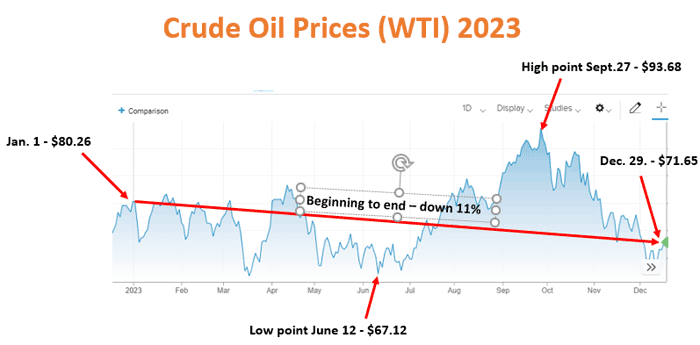
It was a down year for oil prices. At the start of January crude was $80.26 per barrel, and it went down from there through mid-year, reaching a low of $67.12 in June. Then came a rally from there to $93.68 in September. Then came another fall though the end of the year, ending December at $71.65, down about 11% from the start of the year.

Similar story for US on-the-road diesel prices, which started the year at $4.58 per gallon, and ended December at $3.91. The peak was in June at $5.78.
Freight volumes were mixed. The Freight Tonnage Index from ATA for November (the most recent report) was down a slight 1.2% versus 2022. but that was the ninth straight year-over-year decrease. The index stands at 114.7, meaning it is up 13.7% versus baseline 2015 levels (index = 100).
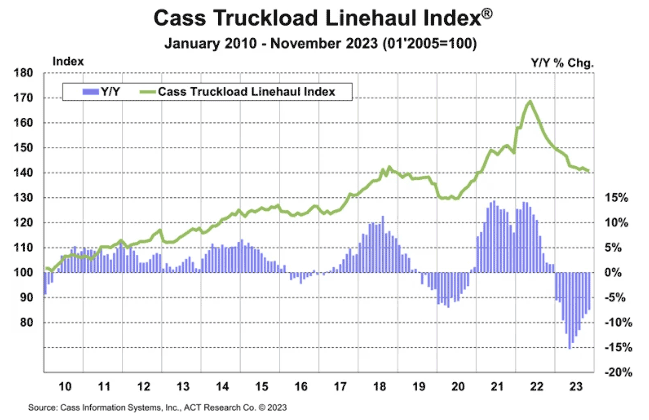
The Cass Linehaul Index, which tracks per mile truckload contract rates in the US before any fuel surcharge or other accessorial fees, has been down year-over-year since mid-2022, as seen in the chart below. The index is now back to mid-2020 rate levels.

It was again not good first half for US railroads. Total US carload traffic for 2023 (51 weeks) was 11.5 million, up 0.6% from the same period last year. Intermodal traffic was 12.5 million units, down 5.0% from last year. Total combined US rail traffic for the first 51 weeks of 2023 was 23.9 million carloads and intermodal units, a decrease of 2.4% compared to last year.`
In terms of ocean container shipping rates, after a terrible drop throughout 2022, the China Containerized Freight Index started the year at about 900 and then fell to about 825 in mid-year, but ended at near 950 relative to the cost to ship a container on average out of China. The index was at 3250 at the beginning of 2022.
Ecommerce sales growth grew decently. According to data from the Census Bureau, on-line sales growth in Q1, Q2,and Q3 was 7.6%, 7.6% and 7.5%, respectively, versus 2022. That left on-line sales at 15.6% of total retail, ,though SCDigest calculates this in a different way (eliminating auto sales, for example) that results in s higher percentage.
I have lots more but am out of space. Hope you enjoyed all this.
What is your reaction to supply chain 2023 in numbers and charts? What numbers would you add? Let us know your thought at the Feedback section below.
Your Comments/Feedback
|