Wrapping up our review of the year in supply chain 2018, this week we offer our popular look at the past year in numbers and charts.
Last week, I summarized what I thought were the key supply chain themes and trends of 2018 (see Supply Chain Year in Review 2018), which included our top supply chain stories of 2018 by month.
I will note my efforts this year were somewhat hampered by the goverment shut down, as most data usually compiled by various agencies has for now come to a halt, meaning numbers for Nov.-Dec. and year end are not available.
Gilmore Says.... |
 |
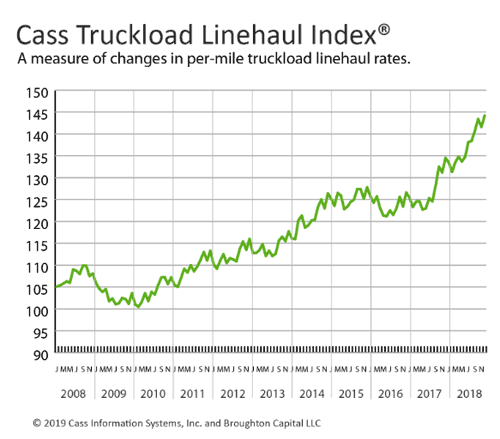
| The Cass truckload Linehaul Index,which tracks truckload rates, was up 6.5% year-over-year every month of 2018. |
 |
What do you say? |
|
| Click here to send us your comments |
| |
|
|
|
So, let's get right to it.
It was a strong year for the US economy. Q1 started off the year better than most recent years with 2.6% real growth. That was followed by year-over-year growth in Q2 of 2.9% and 3.5% in Q3. The Atlanta Federal Reserve is estimating Q4 growth of 2.8%. It is possible full year GDP growth will be above 3% - something the US economy has amazingly not achieved since 2005, the longest streak on record.
But there are some signs of slowing growth. China's 2018 GDP growth of 6.6% was its lowest performance in 28 years.
Looking forward, the IMF estimates global GDP growth will be 3.5% in 2019, a number slightly lowered from the previous estimate due to continued trade war fears. It estimates US growth of 2.5%, and only about half that in Europe (see Graphic of Week nearby).
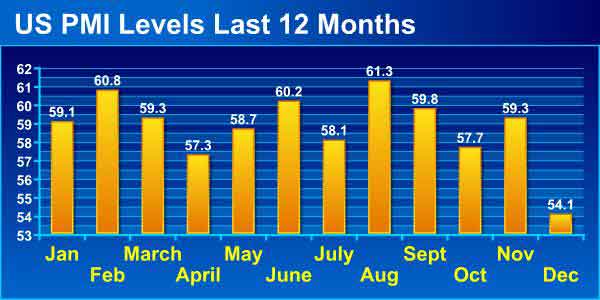
Consistent with the GDP growth, the US Purchasing Managers Index from the Institute of Supply Management was very strong in 2018, easily above the 50 mark that separates manufacturing expansion from contraction every month, as seen in the chart below - though ending the year with a sharp decline in the rate of growth.
In fact, the full year PMI average of 58.8 was the highest since all the way back in 2004.
Another view of US manufacturing strength is the index on output for US factories from the Federal Reserve.
As can be seen from the chart below, US manufacturing output has been flatish for many years now, and in general was been up modestly most months in 2018, though lately increasing.
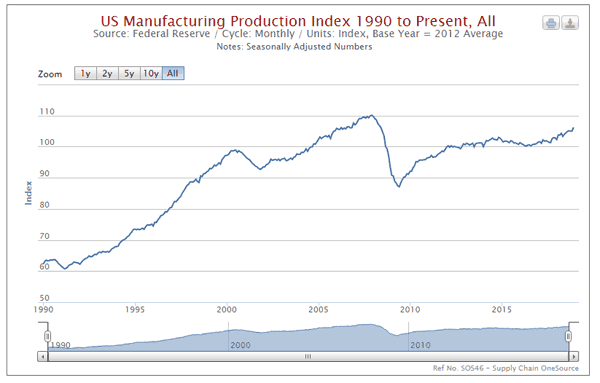
With a score of a strong 106.2 in December, US manufacturing output was still just 6.2% above the average month in the baseline year of 2012, indicating very weak annual growth of less than 1% in the six years since.
What's more, as can also be seen in the chart, that also means 2018 output remains well below the peak year of 2007, when the index reached an historic high of 110.0 in December.
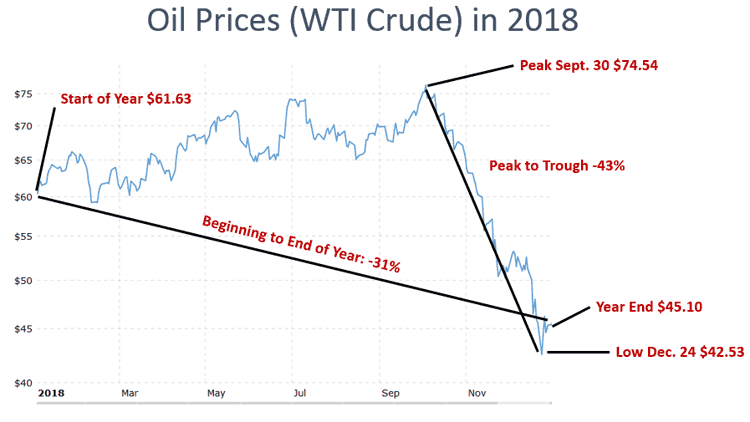
Oil prices had an interesting interesting year. WTI prices started rising in July of 2017, and as can be seen below and kept rising from the start of the year into September, when it hit $75/barel, with some predicting $100 soon. But the bottom fell out right after that, with WTI down 31% from the start to the end of the year.
US diesel prices showed lest volatility, starting the year at $2.97 and then staying within about 30-40 cents of that price before reaching a high of $3.39 in October. But diesel prices ended the year about where they started, at $3.04.
Commodity and input prices were generally up for most of 2018, with talk that inflation was re-entering the supply chain. The ISM Prices index was up for the 34th straight month in December, though the rate of increase was slowing as the year ended.
Freight volumes all told were very strong though perhaps slowing as we ended the year. the ATA Freight Tonnage Index was up 6.6% for the full year, the largest annual increase since 1998 and double the 3.7% increase in 2017. However, freight volumes were down 4.3% in December versus November.
.
Rising volmes plus the driver shortage naturally pushed truckload rates higher - much higher.
The Cass truckload Linehaul Index,which tracks truckload rates, was up 6.5% year-over-year every month of 2018, and up more than 9% May through September. It ended the year up a robust 7.2% in December.
It was again decent year for the railroads. Total US carload traffic for 2018 was up 1.8%, while intermodal traffic up 5.5%. Combined rail volumes were up 3.7%.
In terms of ocean container carriers. the China Containerized Freight Index started the year at about 825 (versus 1000 in the baseline rate in November, 2012), and in general rose slowly for most of the year, though not enough to deliver strong profitability to container carriers. The index ended the year a little above where it started.
The WTO recently projected that the volume global trade was up 3.9% last year, down from 4.2% in 2017, and right around global GDP growth. Not long ago, trade far exceeded GDP growth. It estimates a lower 3.7% trade growth in 2019.
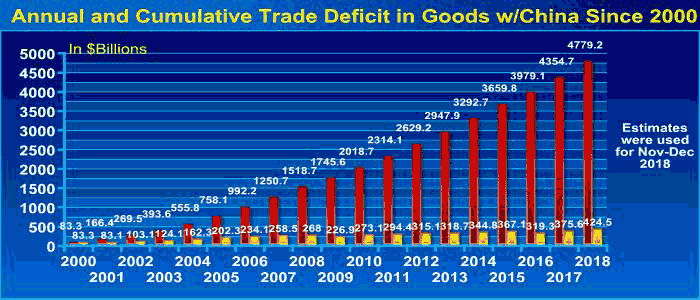
The US trade deficit continued along, coming in at generally over $50 billion each month, up from $45-50 billion in 2017 but down from about $60 billion per month pre-recession. The trade deficit in goods with China also stayed strong, again setting a record despite tariffs at what I estimate as $424 billion for the year, in the absense of recent month data from the Census Bureau. The cumulative US trade deficit with China since 2000 is an incredible $4.8 trillion, as shown in the chart below.
The growth of ecommerce sales in the US also rolled on, up 16.3%, 14.9%, and 14.5% in Q1 through Q3, respectively. Ecommerce represented 9.8% of total retail sales in Q3, by the government's calculation, but the way SCDigest figures it, the share is now over 11%. Total retail sales were up a a strong 5.0% or so in 2018, but ecommerce continues to rapidly gain share.
Amazon's overall revenues through Q3 up 37% to an incredible $160.5 billion, meaning full year 2018 sales will be close to an "Amazonazing " $200 billion when reported soon.
Amazon on-lines store sales though Q3, however, were up just 10%. But Amazon saw 31% growth in services, which includes its marketplace, fulfillment by Amazon, and web services. Amazon had record profits through Q3 of $7billion, versus $1.95 billion in 2017. It employes 613,000 people.
I have lots more but am out of space. Hope you enjoyed all this.
What is your reaction of supply chain 2018 in numbers and charts? What would you add? Let us know your thought at the Feedback section below.
Your Comments/Feedback
|


