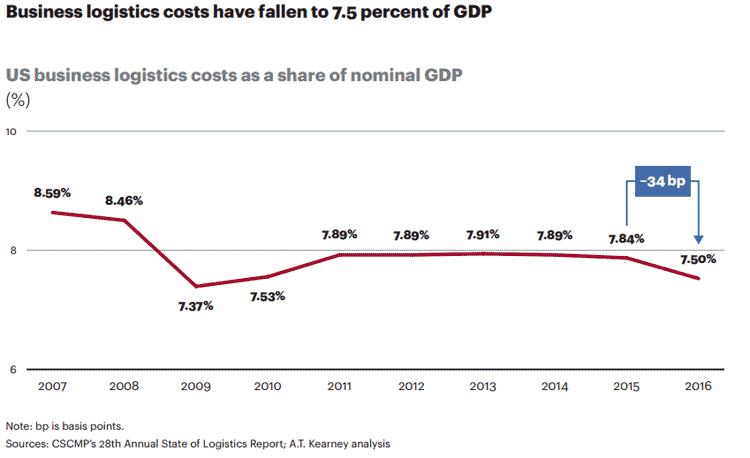
The annual State of Logistics report is just out again with much fanfare from CSCMP, with the headline news that overall relative US logistics costs were modestly down for the third straight year in 2016, to 7.5% of GDP from the 7.84% seen in 2015.
Importantly, a revision to how the data is compiled first implemented last year has in fact taken that metric down noticeably from the numbers in previous years. Before the change, for example, logistics costs were said to be 8.4% of GDP in 2014, versus the 7.89% estimated in this year's version.
Gilmore Says.... |
 |
| The total cost of US logistics was estimated at $1.392.6 trillion for 2016, $20 billion or so below 2015 costs under the new calculation. |
 |
What do you say? |
|
| Click here to send us your comments |
| |
|
|
|
I still can't find the details as to how and why the data was revised, but the good news is that the report went back and redid the numbers for the last 10 years using the new methodology. While the numbers are now lower by roughly half a percentage point each year than they had been calculated previously - meaning logistics costs are a lower burden on the US economy than previously thought (all told a good thing) - the changes in percentage terms year-over-year seem about the same even at the new lower absolute levels, so the big picture of the trends seems mostly unaffected.
The peak year in the past decade - as it was under the previous calculation - was 2007, when logistics costs hit 8.59% of GDP.
I will note in passing that in many years some media commentators have opined that dropping logistics costs as a share of GDP is a bad thing, which of course is nonsense unless you are a carrier or perhaps a 3PL. Countries with immature logistics systems have a much higher share of GDP devoted to logistics than does the US - though I will add that such decrease in logistics costs often does result from a weak overall economy.
This now the second report from consulting firm AT Kearney since it took over authorship of the report after a competitive bidding process by CSCMP two years ago. The lead author is Kearney's capable Sean Monahan along with a number of his colleagues, but a number of contributors from industry also called out (e.g., Dupont's Miguel Gonzalez, Charles Clowdis of IHS Markit, among several others).

This represents the 28th edition of the report, which was launched in 1988 by the late Bob Delaney and sponsored by his company, Cass Information Systems. Somewhere along the way, CSCMP took over the sponsorship, and in the late 1990s Rosalyn Wilson, who has a long career in the logistics industry, began to support Delaney in his efforts. Upon Delaney's passing a few years later, Wilson took on the challenge alone, largely keeping the existing methodology, heading the report until Kearney took on the job in 2016.
Again this year, Penske Logistics funded the report development, and the results were as usual released at a major media event at the National Press Club in Washington DC on Tuesday. I almost made it, but was thwarted by a much delayed flight.
There is no question that again this year we have a much more modern looking and better formatted document, with high quality graphics, though in the end it largely plows the same ground as previous reports but with more polish.
That said, even more so this year the report tries to combine a look at the data from 2016 - now almost six months old - with a fresh insight on trends so far in 2017. This is a tough mission that the report does pretty well, though I expect this will evolve over time. I have some ideas.
The report notes that actual US business logistics costs (for which we now get the new acronym USBLC) actually fell in absolute terms in 2016, dropping 1.5% year-over-year. That is a big change, with absolute logistics costs rising by an average of 4.6% annually between 2010 and 2015, fueled mainly by 3.6% annual growth in transportation costs. Keep in mind the report deals exclusively with nominal costs, not so called "real" changes that are adjusted for inflation.
So, simple to say, harder to calculate, you take the number for US logistics costs and divide it by annual nominal GDP numbers and voila, logistics costs as a percent of GDP emerges. The methodology must use nominal not real GDP as the denominator because the costs for the year are compiled in nominal terms.
The decline in USBLC in 2016 was broadbased. Transportation costs - the largest single component of USBLC at 64.2% of the total - fell by 0.7% in absolute terms in 2016. The second component, inventory carrying costs (29.4% of the total), fell a significant 3.4% last year despite rising rates for warehouse space, as the cost of capital (which drives the cost of holding inventory) fell sharply during the year. "Other" costs - always somewhat vague and mostly related to certain IT expenses - were down 2.0%, though this is by far the smallest of the three categories at just 6.3% of the total number.
The total cost of US logistics was estimated at $1.392.6 trillion for 2016, $20 billion or so below 2015 costs under the new calculation. It includes things like pipelines and inland waterways in addition to more common cost buckets.
Within transportation, trucking-related spend (including private fleets but excluding parcel) comprise 66.6% of total transport costs and 42.7% of total logistics spend. Parcel was broken out for the just the second time this year as a separate cost category - logical given the rise of ecommerce- and estimated at $86.3 billion in total, or 9.6% of transport costs (up from 9.2 in 2015) and 6.2% of total logistics spend.
At $71.9 billion in 2016, rail comprises 8.0% of transportation spend and 5.1% of the total logistics costs. Rail spend was down sharply last year, mostly due to plummeting coal volumes.
One thing I cannot find again in this year's report that I liked in the past was a breakdown between "local” versus" intercity” transport costs - not sure if it is just gone or buried somewhere I haven't found yet.
In terms of growth in spending by these various categories, the 5-year average annual growth rate in costs by mode or cost category are as follows, according to the report:
Truckload: 4.3%
LTL: -1.2%%
Private/dedicated fleet: 5.7%
Trucking combined: 4.3%
Parcel: 6.4%
Intermodal: -0.5%
Rail total: -1-1%
Air freight: 2.3%
Inventory carrying/warehouse costs: 0.5%
With overall logistics cost rising 2.6% per year over the past five years, comparing the rise in any specific area versus that 2.6% overall number will indicate whether it is gaining or losing share of total spend.
Trucking, for example, is still gaining in share of spend versus rail, while truckload and parcel are gaining share versus LTL. I am very surprised intermodal costs have been averaging less than GDP or overall logistics spend growth. Inventory carrying costs are flat, again the result of lower interest rates even as storage costs are up (3.6% annual growth over 5 yeas) and inventory-to-sales ratio levels are rising modestly over 5 years until the second half of 2016 saw a downward trend.
The report has a lot more detail on each mode and cost bucket, as well as the overall economic and logistics environment, which I don't have room for here.
The 2017 report again has a decent amount of overall commentary on the current environment, under the theme of what it calls "accelerating into uncertainty." The sense of that is that there are so many unknowns out there, such as the direction of the economy, where global trade is headed, the regulatory environment, and more, at one level the smart move would be to hunker down on logistics investments until the path forward is more clear.
But it may never be clear, and falling behind in this era of great logistics innovation is a recipe for losing competitive advantage or worse.
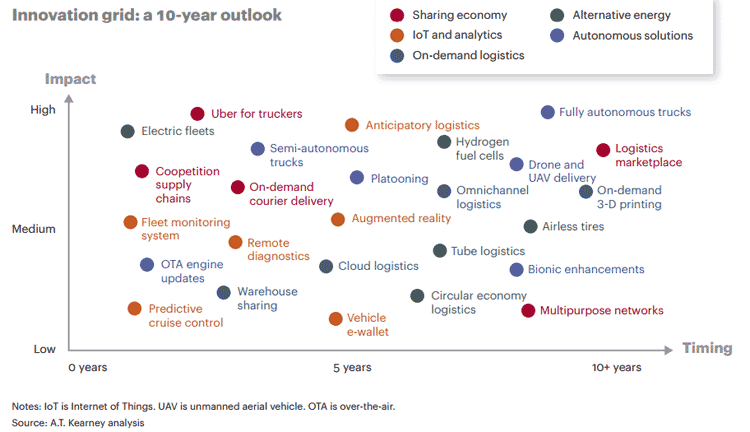
On that same theme, I liked this chart from the report, which shows what it calls an "innovation grid" that positions a variety of new age technologies based on their likely timeframe of being ready for prime time versus their impact on logistics.

So, a good effort again by Kearney and CSCMP. I would like to see a bit more commentary on what the data as a whole is telling us, beyond all the detail for individual cost buckets, but I am sure we will see improvements over time after this solid second edition under AT Kearney's stewardship.
CSCMP members can already download a copy for no charge, others purchase one for a modest cost.
Any reaction to our summary of this year's State of Logistics Report? Do you like the new style? How could it be improved? Let us know your thoughts at the Feedback section below.
Your Comments/Feedback
|