It is a big time cliche, but a picture really is worth a 1000 words.
I can say that definitively, because when I put togeter these reviews of the past year or half year in supply chain, the graphics I use really do tell the story.
Gilmore Says.... |
 |
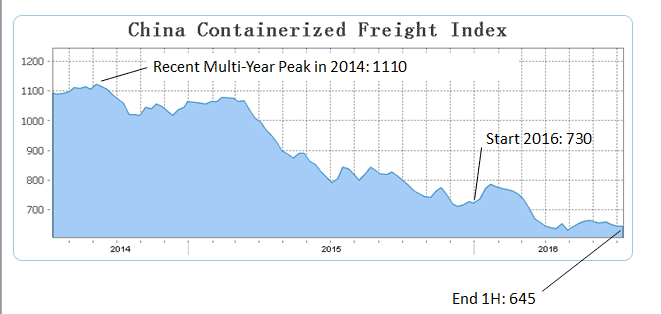
| It was great times for global shippers too, as Chinese Containerized Freight Index continuing to fall, down to 650 or so recently from a recent high of 1110 in 2014. |
 |
What do you say? |
|
| Click here to send us your comments |
| |
|
|
|
Last week, I provided a month by month chronology of the top stories for the first six months if 2016, which you will find here: 1H 2016 Supply Chain Review.
This week, I am back with a look at the 1H in what I call numbers and charts.
The economic environment that has such a big impact on our supply chain was mixed, as it has continually been for a number of years. Q1 US GDP was finally pegged at a weak 1.1%, with a slow start to the year yet again, repeating a recent pattern. China's growth fell below 7%, and perhaps quite a bit below, while Euro Zone growth was about just 0.5%.
Q2 is likely to be better, but the weak Q1 number likely means we will see tepid full year growth once more, somewhere just over the 2% mark.
The International Monetary Fund has recently predicted 2.2% US economic growth for 2016, down a bit from earlier forecasts, and global growth of a weak 3.2%, about the same as 2015. Meanwhile, the level of global trade continues to fall below the level of economic growth - a big change from a few years ago - and has basically been flat for past 18 months, according to a report jus this week from the UK's Financial Times. Does this spell looming troubles?
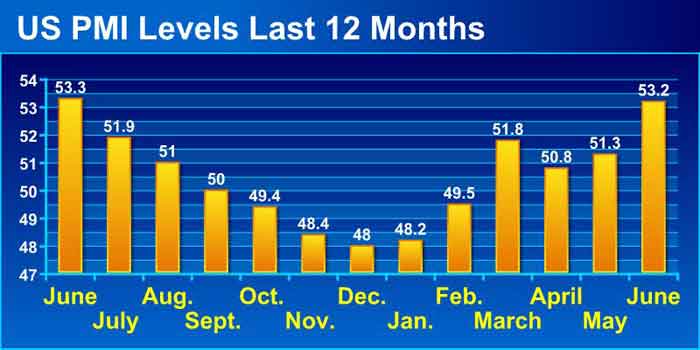
US manufacturing, once a bright spot early on in the pseudo-recovery after the Great Recession, has been flat for a long stretch, including the 1H of this year. The US Purchasing Managers Index from ISM paints a mixed view, ending a five-month string below the 50 mark that separates manufacturing expansion from contraction in March, the first of four straight months then above 50 through June.
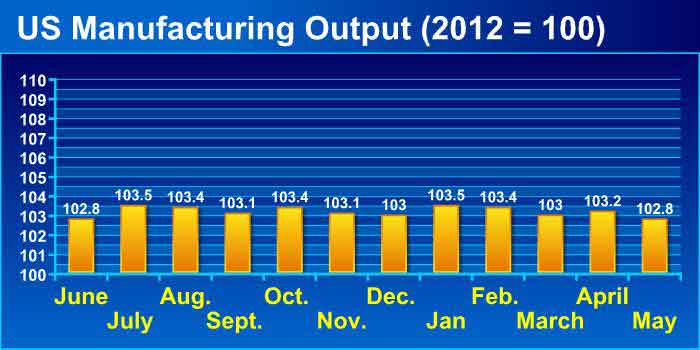
But US manufacturing output numbers have been flat for a year, according to the Federal Reserve estimates, with the index numbers as shown in the chart below relative to the baseline year (index = 100) of 2012. As can be seen, there has been no increase in 2016, and the scores around 103 mean just 3% growth in output since 2012 - less than 1% per year.
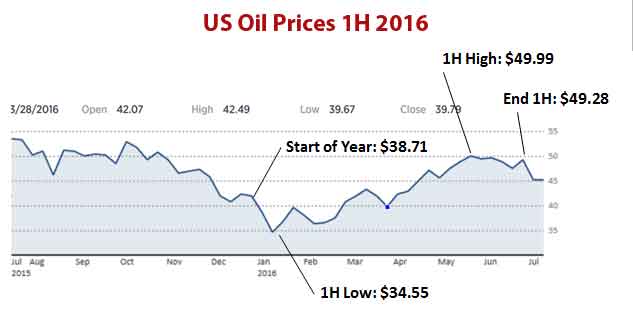
Oil started the year continuing a plunge that began in 2015, falling to the low 30-dollar range in January, as gas and diesel prices followed suit. That as OPEC decided to keep pumping despite the low price to drive out US frackers.
That strategy partially worked, and oil started to climb again in April, almost hitting $50 mark for a bit, now settled in at about $45 per barrel. Diesel prices fell nationally to just below $2.00 per gallon in late February, increasing to a still modest $2.40 or so recently with the rise in oil.
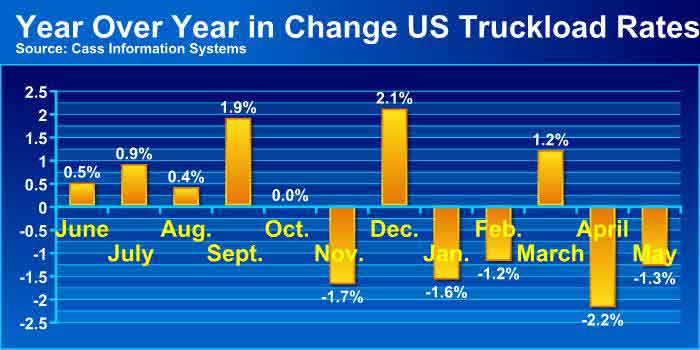
Those lower fuel costs and a generally weak freight environment made it good times for shippers. The Cass Linehaul Index, which measures per mile US truckload rates before accessorials, fuel and other charges, fell four out of the first five month year over year, a big change from 1H 2015 when rates rose rapidly.
Meanwhile, through May the Cass Intermodal pricing Index has fallen an incredible 17 consecutive months.
It was great times for global shippers too, with the Chinese Containerized Freight Index continuing to fall, as shown below, down to 650 or so recently from a recent high of 1110 in 2014, as rates are below variable costs for many/all container lines, leading to the recent consolidations.
I have more but am out of space. Hope you enjoyed this review in numbers and charts.
Anything we missed? What do these trends tell you? Let us know your thoughts at the Feedback section below.
Your Comments/Feedback
|


