 |
February 21, 2013 - Supply Chain Newsletter |
 |
 |
New Survey: The State of Global Transportation Management |
 |
|
|||||||||||||||||||||||||||||||||||||||||||||||
2013 Priorities Part 2: Mapping and Modeling Your Supply Chain
|
||||||||||||||||||||||||||||||||||||||||||||||||
| GILMORE SAYS: |
"The very act of looking at the true physical design, the product flows, and demand and supply centers will produce almost instant insight into potential issues or opportunities for further analysis." WHAT DO YOU SAY? |
A few leaders, such as Apple, appear to have fully mapped their supply chains, but I argued most have not, a perspective that received some support from Greg Schlegel of Lehigh University, who wrote in to us last week and said "Through four years of teaching and global workshops, it seems 95% of all manufacturers do NOT map their supply chains!"
So this week, let's turn to modeling, and indeed, there is some overlap, as we will get to shortly. Before that, I want to acknowledge some input I received for this article from our own columnist Mike Watson of Northwestern University, Dr. David Simchi-Levi of MIT, and Toby Brzoznowski of network design software provider Llamasoft, each a true world class expert on the subject.
So, what does it mean to build a supply chain model? Well, a quick internet search on the definition of "model" turns up this as one of the choices: "a technical representation of how something works," and in this case that is just about right for defining supply chain models. As I said last week, mapping is again about knowing your supply chain, and modeling is about understanding how it works.
I will cite two interesting examples. Two or three times I have seen presentations by UPS executives on how the network models they have built guide their decisions almost daily. If a part of its network will take a hit, for whatever reason, UPS understands what the impact is going to be, and how to optimally deploy resources elsewhere to best solve the problem. The scope of this tool as I have heard it described - I assume built over many years - is simply astounding.
Second, in 2011, when the Federal Motor Carrier Safety Administration was pondering changes to hours of service rules, an executive from trucking giant Schneider National made a presentation to the agency in which he described how Schneider had worked with Princeton University to model its network. So, it was able to input the proposed changes as new rules or constraints and calculate with a great deal of precision how they would impact Schneider's driver and asset productivity. Pretty cool. That capability - translated into the specifics of your company's supply chain needs - would be pretty nice to have, would it not?
So, that is two very large companies with very specialized needs, but the same general principle applies to nearly everyone, if in slightly different ways. Our supply chains are network(s) that operate according to certain strategies, rules and constraints. There are inputs and outputs - and the inputs in this volatile age (transportation costs, for example , or customer demand) are often changing, leading to a change in outputs (e.g., supply chain cost).
So does it not makes utter sense in this era to have at least some digital models of your own supply chain, so you can also understand how actual or potential changes are going to impact its performance?
You could perhaps build these models yourself, and companies with unique needs will sometimes do this, usually with outside help. That's on the high end. On the low end, there are probably some things you could do in a spreadsheet, if you have the time and a very small or simple supply chain.
But there are many thousands of companies that do not have that simplicity, and in fact are seeing their supply chain complexity increase from organic growth, acquisition, globalization, virtualization, and more. As I have noted before, it wasn't long ago the threshold for being considered a large company was $1 billion in annual sales. Now, a company that size is considered medium at best - yet, it could have a very complex supply chain.
Fortunately, there are a number of tools out there that can help companies create those models, and it really is likely to be models with an S, not one single galactic model, as I will discuss in more detail in a moment. They often go under the name of "network design" software, and while that is an accurate term for what they can do, also implied in the term I think is that they are really just appropriate for companies planning a full review of their networks and or major transformations of their physical supply chains.
And that would be an incomplete view. Many companies, in fact, start with simply modeling their existing supply chains, and it is perfectly acceptable to look first at simply improving the flows and performance of that existing network without any notion of closing facilities or major changes to what is in place currently.
So you in fact start here also by mapping your supply chain, but in a different way than the mapping I referred to last week, which was more related to understanding and reducing risk. Here the goal is to see what your supply chain really looks like from a physical perspective, and probably more importantly from the "product flow paths" embedded now in this physical supply chain.
Back in the day, I was involved in a number of projects we will call distribution center "activity profiling" - a summary and analysis of the real data relative to volumes, seasonality, order profiles, etc., in a DC Never once did the data not offer some insight contrary to what a DC manager or logistics executive believed what was true about their operations, sometimes to the point that they would challenge the accuracy of the data.
There is a related phenomenon relative to supply chain network modeling. The very act of doing so and looking at the true physical design, the product flows, and demand and supply centers will produce almost instant insight into potential issues or opportunities for further analysis. (I will note, companies usually/often split the mapping into two views, supply-centered and demand-centered, and begin with one or the other).
So from this relatively simple exercise (yes, how simple depends heavily on how readily available supply chain data is), you now have a digital model at some level of your supply chain, for which you can initially and over time ask it what the results will be if changes are made to strategy , inputs, constraints, etc.
Who wouldn't want this type of capability? Yet, while an increasing number of companies are taking this modeling approach, far more are not. But for those that have, it often becomes a way of supply chain life - every decision is "run through the model" before it is put into effect.
So, where do you start?
Watson says "a company should start small-- they will learn a lot about their supply chain and also learn more about what a large model may look like." Earlier this year, he wrote a column on this, which you will find here: The Top Five Models You Should Build in 2013.
So, can you build one giant and comprehensive supply chain model, rather than a series of models for different aspects of your supply chain? Well, software and especially hardware advances are making this a goal increasingly in reach at one level, but the reality is that the models need to be developed, obviously, according to the questions that are going to be asked of it.
Simchi-Levi told me, for example, that "there are different levels of supply chain analysis - strategic, tactical and operational - and they span different time frames, ask different questions, use different data at a different level of aggregation and require different modeling and analytic tools."
But in the end, that question doesn't really matter. I believe companies that map their supply chains will reduce supply chain risk and find opportunities for collaboration and control. Developing models of a company's supply chain is becoming almost a competitive necessity in today's global, complex and dynamic supply chain world. Let's get started with both in 2013.
Two final notes: I had a great related discussion with Llamasoft's Brzoznowski on a videocast earlier this week, which you will find on-demand here: Building Network Design as a Core Competence.
And last week, I manage to mix up Tom Linton's career path. He is currently chief procurement & supply chain officer at Flextronics, and formerly head of procurement for LG Electronics. I initially had it reversed.
Do you agree it is time more companies map and model their full supply chains? Have you done so? Let us know your thoughts at the Feedback button (email) or section (web form) below.
![]()
| View Web/Printable Version of this Page |
|
|
|
YOUR FEEDBACK
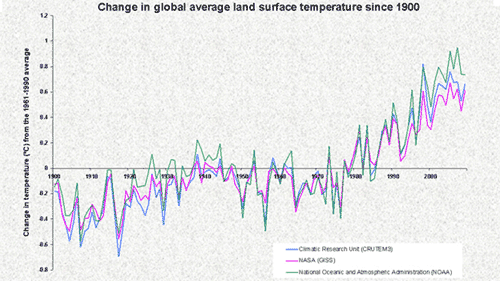
Just to reinforce that we are pretty straight shooters here at SCDigest, we mostly feature this week. a couple of fairly critical emails we received in the last week commenting on the way we covered two separate stories: one on the rejection of the leadership-approved new contract by the clerical workers union rank and file at the ports of LA and Long Beach, and another on a recent graphic of the week on the change in global temperatures over the past century.
We reviewed how we did it in both cases based on this Feedback, and feel very very comfortable with how we covered both stories, as explained in the Editor's Note following each comment. But you can judge for yourself.
Feedback on Temperature Chart:
I am extremely disappointed in SCDigest for including this story in what I've always regarded as an authoritative source of supply chain related information. http://www.ucsusa.org/publications/got-science/2012/got-science-november-2012.html Paul Brunning Editor's Response: Thanks for writing. You may not like the Cato Institute, but the data in that chart is not theirs directly. We just happened to find their version of it from NASA numbers or whoever it was. As per the links provided, there are many that don't like Cato's conclusion or perspectives, but the temperature patterns/data points in that chart I do not believe are at all in dispute. I found this graphic. It appears Cato was using the NASA numbers, in the pink.
I found those temperature patterns interesting, and they were something I didn't know. But appreciate the Feedback.
Dan Gilmore |
||
| Feedback on Clerical Workers Reject Contract | ||
I am in favor of critical analysis of events but what I see in your article is a very biased response to the Union's rejection including what appears to be out-of-context comments vilifying the union. You state that, "At this point, it is not clear what the union is unhappy with in this new contract." I would be more likely to feel that this was a fair and honest report if you stated that we contacted a spokesperson from the Union (and include their name) and here is their side of the story. There is nothing in your article that states the Union's side of the story. Nor is there anything that indicates that you made any attempts to get their side of the story. As a consequence, it appears that you believe that the Union is in the wrong no matter what their position is. I certainly can't make a judgment based on the information in your article. I should add that I come without any preconceived notion of the validity of each party's positions (as your article introduced me to this subject). In short, it appears that your journalistic standards are not a high priority and I would have hoped that you would do better. Buddy Hoffman Editor's Note: Thanks for writing. Virtually every report on this was similar: http://www.latimes.com/business/la-fi-ports-strike-20130209,0,5507291.story As you can see, the union was not making statements about the underlying reason for the rejection. "The union and employers aren't talking about why some members went thumbs down on a settlement, which was celebrated by both sides at its Dec. 4 unveiling and initially appeared headed toward easy ratification." the LA Times wrote. Likely because the union itself is trying to figure that out, given its leadership had approved the contract obviously (that's why it went for a vote). The union may be as perplexed as most of the rest of us are. At the time the deal was reached, the union leadership was in a sense bragging about what a good deal they reached. Given that, the statement "At this point, it is not clear what the union is unhappy with in this new contract." seems perfectly reasonable to me. Probably should have added there was no comment at that point from the union (nor still) but we were rushing to get this important story out. Dan Gilmore |
||
Is it time for a Reagan era response to the Longshoremen? Reference of course to the Air Traffic Control situation that Reagan had the fortitude to face. At what point do we say - enough is enough? Our port productivity is one of the lowest in the world, and why do we continue to be held subject to the incredible demands of our port workers? Ports around the world out perform and provide a very high level of service at much different levels of compensation. Why do we accept less? Roger W. Woody
|
SUPPLY CHAIN TRIVIA ANSWER
Q: What are the top five largest 3PLs (globally) by revenue?
A: Assuming the results haven't changed from year end 2011: (1) DHL Supply Chain and Global Forwarding; (2) Kuehne + Nagel; (3) DB Schenker Logistics; (4) Nippon Express; and (5) C.H. Robinson Worldwide.
| © SupplyChainDigest™ 2003-2013. All Rights Reserved. SupplyChainDigest PO Box 714 Springboro, Ohio 45066 |
POWERED BY: XDIMENSION
|


