Search By Topic The Green Supply Chain Distribution Digest
Supply Chain Digest Logo

Supply Chain News Bites

Supply Chain Graphic of the Week: US Truckload Rates Since 2010

Rates Up 38 % in 14 Years

Nov. 21, 2024


The monthly freight report from Cass Information Systems for October was released last week, with a variety of metrics based on based on data from the billions of dollars of freight bills that Cass pays for its shipper clients.

That includes its monthly Linehaul Index, which measures US per mile truckload rates before fuel surcharge and other accessorials, as can be seen in the graphic below:


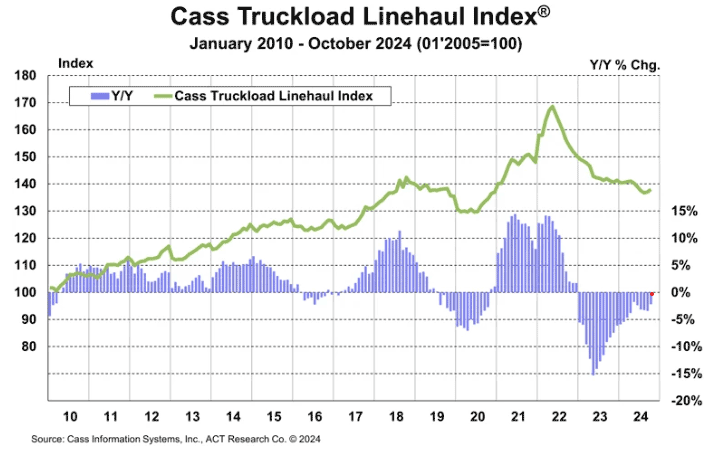
Since peaking in early 2022, the Index (January 2010 = 100) has fallen sharply, to about 138. That means rates are currently up 38% over the 14 years since the baseline month. That’s an average of 2.3% over year, right around the annual rate of inflation.


Any Feedback on our Supply Chain Graphic of the Week? What do you think of this contributor list? Let us know your thoughts at the Feedback section below.


Your Comments/Feedbackh


  .

Features

Resources

Follow Us

Supply Chain Digest news is available via RSS
RSS facebook twitter youtube
bloglines my yahoo
news gator

Newsletter

Subscribe to our insightful weekly newsletter. Get immediate access to premium contents. Its's easy and free
Enter your email below to subscribe:
submit
Join the thousands of supply chain, logistics, technology and marketing professionals who rely on Supply Chain Digest for the best in insight, news, tools, opinion, education and solution.
 
Home | Subscribe | Advertise | Contact Us | Sitemap | Privacy Policy
© Supply Chain Digest 2006-2023 - All rights reserved
.