Last year, the Federal Reserve Bank of New York started taking a structured approach to measuring the level of supply chain stress going on for companies over time.
Right now, that stress is at record lows – more on that in a minute.
To track the level of stress, the New York Fed created something it calls the Global Supply Chain Pressure Index (GSCPI), which the bank says was meant to “develop a parsimonious measure of global supply chain pressures that could be used to gauge the importance of supply constraints with respect to economic outcomes.”
We believe in this context that “parsimonious” means uncomplicated.
The bank’s research indicates, for example, that changes in the GSCPI are associated with goods and producer price inflation in the United States and the euro area, both during the pandemic period and stretching back to 1997 (the starting point of our data set, even though the index itself was just launched in mid-2022).
The index is updated monthly, and is compiled from some 27 data points, with the aim of providing a comprehensive summary of the level of potential supply chain disruptions. The date points include global transportation costs are measured by employing data from the Baltic Dry Index (BDI) and the Harpex index, as well as airfreight cost indices from the US Bureau of Labor Statistics.
The GSCPI also uses several supply chain-related components from Purchasing Managers Index (PMI) surveys, focusing on manufacturing firms across seven interconnected economies: China, the euro area, Japan, South Korea, Taiwan, the United Kingdom, and the United Stated, among other data.
The index score is produced by calculating the number of standard deviations of the combined metrics from all the data sources from average normal times from the start of the data set in 1997.
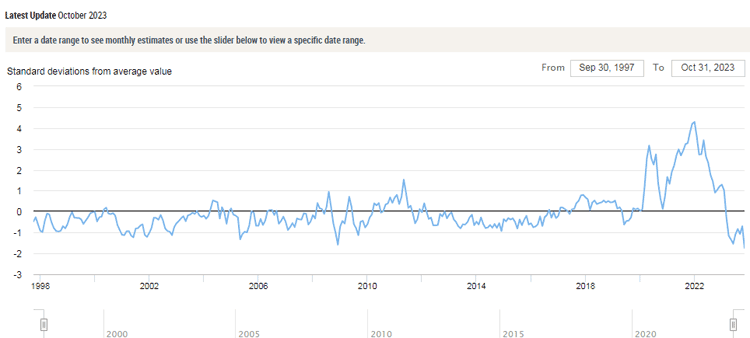
As seen in the chart below, the GSCPI soared starting in October of 2020, peaking at an all-time high of 4.21 in December 2021, when most agree supply chain disruptions and shipping costs were very high.
Global Supply Chain Pressure Index from 1997 to Present

Source: Federal Reserve Bank of New York
But the index started a slide from there, turning negative in January 2023, meaning pressure is less intense the average normal times.
(See More Below)
|
CATEGORY SPONSOR: SOFTEON |
|
|
| |
| |
|
|
In fact, the October 2023 GSCPI index, just released, came in at a record low of -1.74.
So these are very low stress times for supply chain and logistics professionals.
We’ll note the Supplier Deliveries Index from the Institute for Supply Management, published as part of its overall Purchasing Managers Index, continues to show shorter cycle times, while another ISM index shows falling input costs. (See US PMI Shows US Manufacturing Declined for the 12th Straight Month in October.)
Are these the lowest stress supply chain times ever? Let us know your thoughts at the Feedback section below.
|