The American Road & Transportation Builders Association (ARTBA) has just analyzed data from the Federal Highway Administration for 2019, the latest year available. It’s probably a good thing anyway, as 2020 data may have been skewed due the impact of the pandemic.
The headline news: congestion for US truckers cost the economy about $42 billion in 2019.
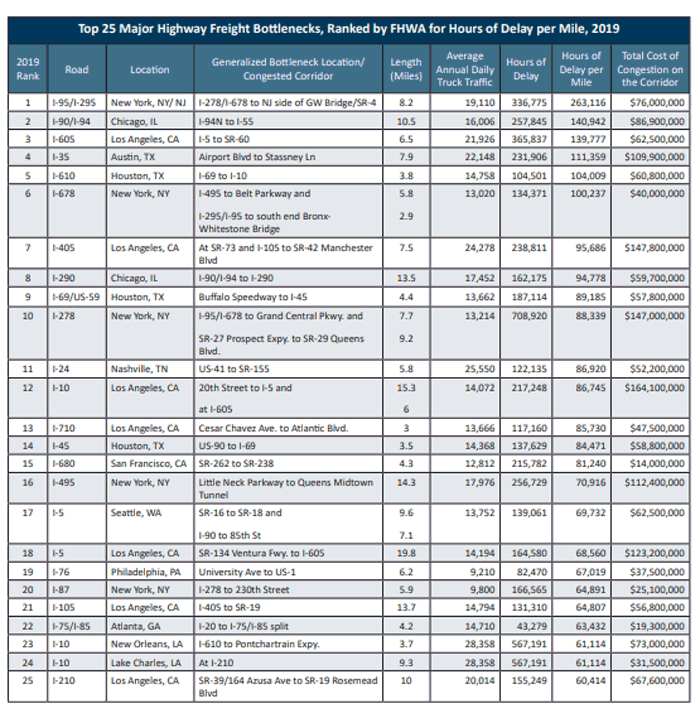
The analysis also found that US freight shipments collectively experienced over 27 million days of delay in 2019, the equivalent of nearly 75,000 years, with over one-third of the lost time occurring on the interstates.
And in no surprise, the report identified major chokepoints as including New York, Chicago, Los Angeles, Austin, Houston, Nashville, San Francisco, Seattle, Philadelphia, and Atlanta.
The FHA data calculates the delay per mile to quantify the cost of bottlenecks across major corridors and compare performance from year to year. Below is a table of the top 25 US freight bottlenecks in the US, based on this data.
The short full report is available here: Throttled: The Economic Costs of Freight Bottlenecks
Any reaction to our Supply Chain Graphic of the Week? Let us know your thoughts at the Feedback button below.
Your Comments/Feedback
|


