How have US trucking volumes grown since 2015?
Each month, the American Trucking Associations releases its Truck Tonnage Index, which tracks volumes hauled by US trucking companies.
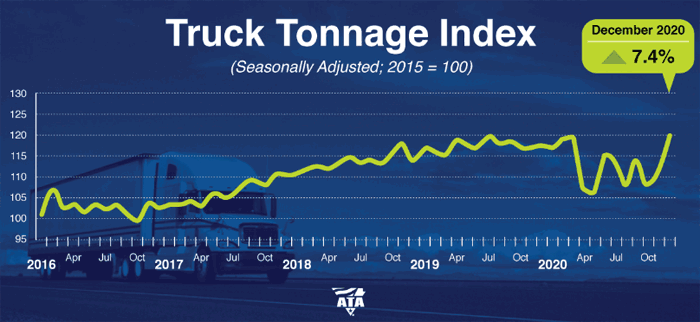
It also publishes a chart of changes to the Index over time, the most recent of which we present below:

Source: ATA
As can be seen, the index uses the average of tonnage in 2015 as its baseline, with an index value of 100.
At the end of 2020 - a year in which tonnage fell 3.3% - the index stood at 120, meaning a solid 20% growth over the five years since 2015. It also reached a peak in early 2020 before following an odd "W" shaped pattern since the start of the pandemic, though ending the year on a high note.
Any reaction to our Supply Chain Graphic of the Week? Let us know your thoughts at the Feedback button below.
Your Comments/Feedback
|