We're' back with one more Supply Chain Graphic of the Week from the recently released State of Logistics Report 2018 from CSCMP and partner AT Kearney.
The chart below from the report shows actual and forecasted growth in revenues for 3PL by three main service categories from 2010 through 2019 (this year and next forecasts of course) in 3 and 4 year blocks. The percentage growth numbers are annual growth over each period.
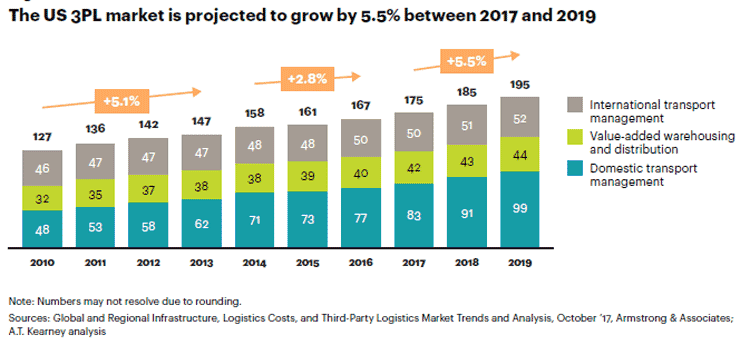
For many years, spending on 3PLs grew much faster than overall US GDP growth, indicating outsourcing was gaining share as a share of total logistics spend.
But oddly, the rate of growth slowed significantly in 2014-2016, falling to 2.8% annual growth, about equal to nominal to GDP growth.
But the report forecasts growth returning to 5.5% annually over the next couple years, in good news for 3PLs.
It's never really been clear what drove the brief slow down.
Any Feedback on our Supply Chain Graphic of the Week? Let us know your thoughts at the Feedback section below.
Your Comments/Feedback
a
|


