Every year, REL, a Hackett Group company, assembles data on working capital management. One of the three components of working capital is inventory, which REL measures in terms of Days Inventory Outstanding, or DIO. DIO is calculated as follows:
End of Year Inventory Level/[Total Cost of Goods Sold/365]
Supply Chain Digest Says... |
 |
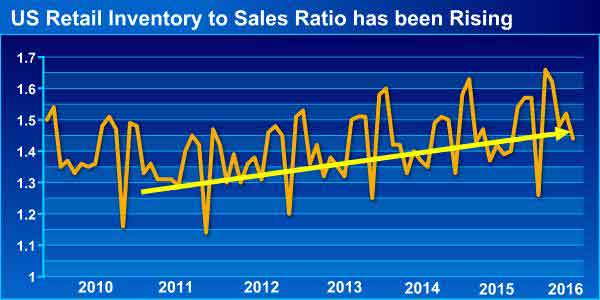
| Retailers also have a higher ITS than do manufacturers or wholesalers. The June ITS, for example, was 1.50 for retailers, versus 1.35 for manufactures and 1.33 for wholesalers. |
 |
|
|
So, you calculate the average cost of goods sold forone day, and then see how many of those COGS days you keep in inventory (based on year-end balance sheet numbers).
As such, DIO is sort of the reverse of inventory turns, in that a higher DIO, all things being equal, means poorer inventory management performance, while a lower number signals improvement. You are being more efficient with inventory versus a given level of COGS. Fortunately, with a number for DIO, inventory turns can also be calculated.
That formula is as follows:
Turns = 1/(DIO/365)
As we reported in the July issue of the Retail Vendor Performance Management Bulletin, retail inventories in general have been rising, certainly as measured by the Inventory-to-Sales (ITS) ratio, published by the US Commerce Dept.
The ITS ratio measures the amount of inventory held as a percentage of one month's worth of sales. As can be seen in the chart below, while the retail ITS is highly seasonal, the trend since 2010 is definitely up.
Visit the Retail Vendor Performance Management home page to learn more
and subscribe to the monthly newsletter.
Retailers also have a higher ITS than do manufacturers or wholesalers. The June ITS, for example, was 1.50 for retailers, versus 1.35 for manufactures and 1.33 for wholesalers.
SCDigest's biggest value-add is taking the data REL makes available to us, based on fiscal year 2015 results, to first re-categorize the companies into more narrow sectors, enabling better comparisons.
This is especially true for retail, for which we break small number of sectors in the REL data into a number of more narrowly defined categories.
We also add in a number of retailers not in the REL data to make some of the retail sector populations more complete. For both REL or SCDigest's work, retailers must be public companies to be able to grab data for COGS and inventory levels from financial filings.
With all that said, here are some inventory turn numbers for leading retail sectors (the numbers in parentheses denote how many retailers are in each category):
• Grocery (8): 13.0
• Home Improvement (3): 4.3
• On-Line (4): 11.1
• Mass Merchants + Dept. Stores (11): 4.2
• Drug Stores (3): 8.7
• Dept. Stores (8): 3.4
• Mass Merchants (3): 8.1
• Footwear (4): 3.4
• Office Products (2): 6.8
• Sporting Goods (3): 2.7
• Electronics (3): 5.6
• Auto Parts (4): 1.5
• Specialty Apparel (15): 4.4
By way of comparison on the manufacturing side, consumer packaged goods companies had 5.5 turns on average in 2015, and apparel manufacturers had turns of just 3.0.
Any comment on this article? Enter below.
Your Comments/Feedback
|