My column a few weeks ago on Walmart and Amazon by the Numbers 2019 once again proved very popular, with a number of readers emailing "give us more." That response, plus the fact that I have a lot of fun doing this, brings me back this week, with some additional data and charts.
Gilmore Says.... |
 |
| Amazon fulfillment costs (FC operating costs, FC depreciation, some inbound logistics costs) were $34 billion last year, up about $36% over 2017 - when "on-line" sales were up just 13%. |
 |
What do you say? |
|
| Click here to send us your comments |
| |
|
|
|
I will again quickly note that a few readers commented that my first column alerted them to the fact that you really have to dig into almost any numbers reported by someone to see if they make sense and/or understand what the data really means in context - take few numbers at pure face value.
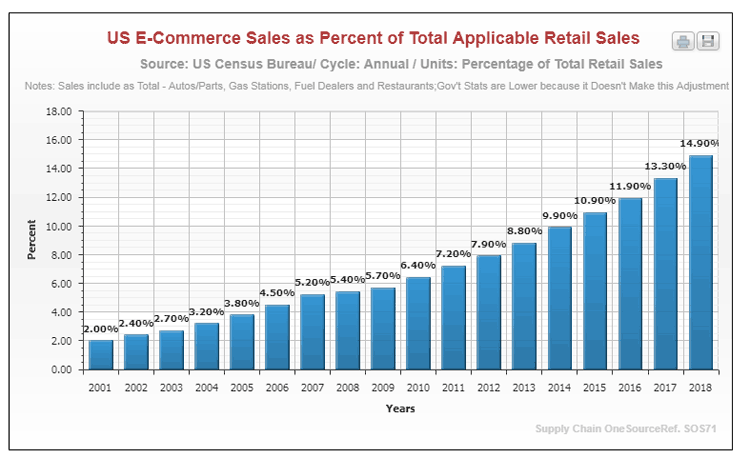
OK, to first put the numbers from both of my columns in perspective, let's first look at the rise of ecommerce. According to the Commerce Dept., ecommerce sales were about 9.9% of total retail sales last year, up from 9.5% in 2017 - but those total retail numbers include sales of cars, gas stations, restaurants and a few other categories that are not really relevant for comparison.
So, we compute the numbers based on the same formula we used in the first column to analyze Walmart's share of US retail, for which we take total retail and subtract out those non-relevant categories. Using that formula, ecommerce sales were a much higher 14.9% of total US retail sales in 2018, up strongly from 13.3% in 2017. Of course, that share is much higher in some product categories, such as electronics and apparel.
In my first column, we also graphed the annual percentage growth for Walmart's US retail sales, which slowed noticeably a few years back but have rallied a bit the last two years. Below we show the Walmart numbers in absolute terms across its three reporting units: US, Sam's Club, and International. All units have seen the pace of growth slow sharply, though US sales were up a solid 4.1% in 2018. The on-going big slowdown in international remains a bit puzzling . Basically, Walmart's total sales are close to flat since 2013.
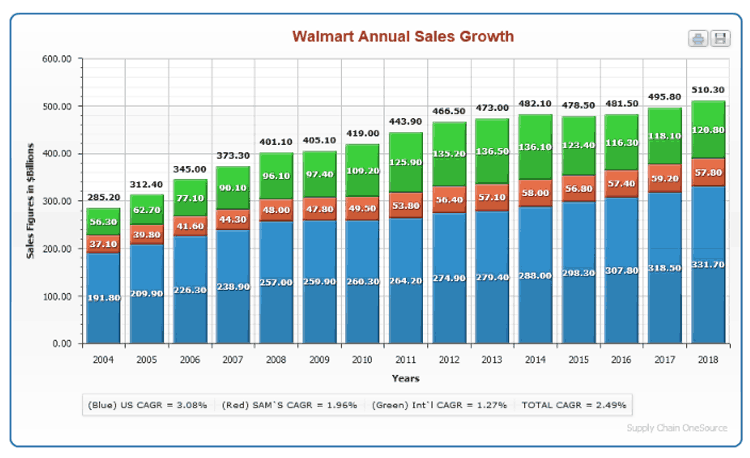
The cumulative average revenue growth rate (CAGR) for each unit and total sales since 2010 is shown beneath the main chart. Walmart has had a CAGR of 5.2% for total sales from 2002 through 2018, but that clearly came much more from the first half of that period than the last few years. Since 2010, total revenue has grown 2.49% annually, with international rising just 1.27% per year, and surprisingly the fastest growth in the most mature segment, US retail, at 3.08%. Still the decent 3% total growth in 2018 represents almost $15 billion in new growth - that's a good sized retailer on its own.
Switching gears, Amazon for years received much criticism for its consistent failure to really make any money, but that started to change in 2016 and was blown up for 2018, as can be seen in the chart below. Net income for 2018 was up dramatically to over $10 billion last year, and reached 4.3% of sales, both those numbers far exceeding previous highs.
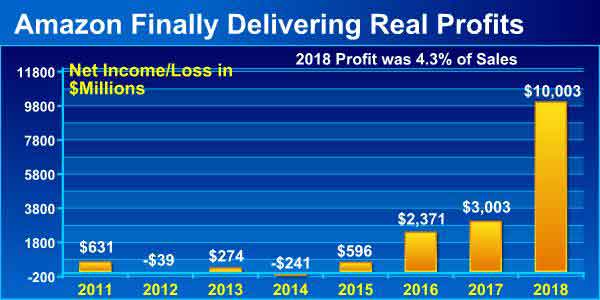
However, 58% of its operating income came from its AWS web services unit.
For years some said to look at Amazon's cash flow from operations instead of profits, a view which has painted a more favorable picture when profits were low.
Operating cash flow as a percent of revenue has generally been much higher at Amazon than at Walmart for many years - and was almost three times so in 2018.
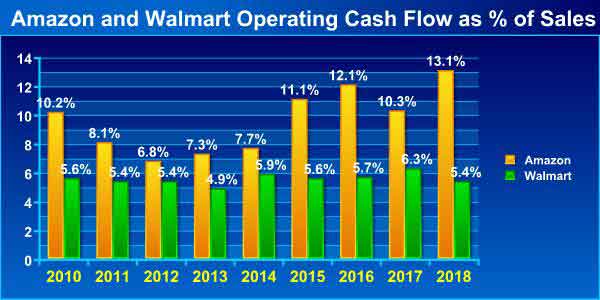
In fact, despite having less than half the revenue, Amazon had higher operating cash flow in absolute terms last year, at $30.7 billion versus $27.7 billion for Walmart.
But there is operating cash flow and then what is called "free cash flow," or operating cash flow minus capital expenditures, and here the story is also interesting.
Amazon had that $30.7 billion operating cash flow in 2018, and had CapEx of about $$13.4 billion, up more than $11.9 billion in 2017. So that means CapEx was 44% of operating cash flow, about the same as 2017.
Walmart, on the other hand, had CapEx of about $10.3 billion - almost the same as in 2017. With $27.7 billion in operating cash flow (OCF), that means CapEx of about 37% of OCF, though with Walmart now generating less OCF than its rival. (Note: as a proxy for official CapEx, I am using spending on real estate, equipment and technology).
Importantly, Walmart also has to pay a dividend from its cash flow- $6.1 billion worth last year - while Amazon does not. So Amazon's operating cash flow minus CapEx spend = $17.3 billion in 2018. Doing the same calculation with Walmart but also subtracting the dividend leaves it with $11.3 billion in free cash. That for the first time is lower than Amazon total.
The dividend factor is huge and a giant advantage for Amazon while it lasts.
In the first column I lamented that Amazon now only provides total shipping costs, not net costs including shipping revenues as it did for years. It also stopped reporting merchandise sales, which I used as the denominator for several ratios, as the best approximation for product sales that require fulfillment and shipping activities.
So I am not quite sure any more how to best quantify fulfillment and shipping cost ratins (shipping is not part of fulfillment costs, by the way).
Fulfillment costs (FC operating costs, FC depreciation, some inbound logistics costs) were $34 billion last year, up about $36% over 2017 - when "on-line" sales were up just 13%.
I have lots more, but I am out of space. Hope you have enjoyed this look at the numbers.
Any reaction to these numbers from Amazon and Walmart? Any other data you would like to see? Let us know your thoughts at the Feedback button or section below.
Your Comments/Feedback
|
|
Srihari
Senior Consultant, Infosys |
Posted on: May, 22 2016 |
|
Great article. I am a little suprised not to see BNSF in the mix while I understand their financial mode/operation is a little different.
That would only give a complete perspective with all the players in the pool.
|
|
Mike O'Brien
Senior editor, Access Intelligence |
Posted on: May, 26 2016 |
|
| Surprised to see Home Depot fall off the list; thought they were winning with Sync? |
|
Julie Leonard
Marketing Director, Inovity |
Posted on: Jun, 27 2016 |
|
Using the right tool for the right job has always been a best practice and one of the reasons, we feel, that RFID has never taken off in the DC as exponentially as pundits have been forecasting since 2006. While these results may seem surprising to those solely focused on barcode scanning, the adoption of multi-modal technologies in the DC makes perfect sense for greater worker efficiency and productivity.
|
|
Carsten Baumann
Strategic Alliance Manager, Schneider Electric |
Posted on: Aug, 19 2016 |
|
|
The IoT Platform in this year's (2016) Hype Cycle is on the ascending side, entering the "Peak of Inflated Expectation" area. How does this compare to the IoT positions of the previous years, which have already peaked in 2015? Isn't this contradicting in itself?
Editor's Note:
You are right, Internet of Things (IoT) was at the top of the Garter new technology hype curve not long ago. As you noted, however, this time the placement was for “IoT Platforms,” a category of software tools from a good number of vendors to manage connectivity, data communications and more with IoT-enabled devices in the field.
So, this is different fro IoT generally, though a company deploying connected things obviously needs some kind of platform – hoe grown or acquired – to manage those functions.
Why IoT generically is not on the curve this year I wondered myself.
|
|
Jo Ann Tudtud-Navalta
Materials Management Manager, Chong Hua Hospital, Cebu City, Philippines |
Posted on: Aug, 21 2016 |
|
I agree totally with Mr. Schneider.
I have always lived by "put it in writing" all my work life. I am a firm believer of the many benefits of putting everything in writing and I try to teach it to as many people as I can.
This "putting in writing" can also be used for almost anything else. Here are some general benefits (only some) of "putting in writing":
1. Everything is better understood between parties involved. There are lots of people types who need something visual to improve their understanding.
2. Everyone can read to review and correct anything misunderstood. This will ensure that all parties concerned confirm the details of the agreements as correct. This is further enhanced by having all parties involved sign off on a hard copy or confirm via reply email.
3. Everything has a proof. Not to belittle the element of trust among parties involved, it is always safest to have tangible proof of what was agreed on.
4. There will be a document to refer to at any time by any one who needs clarification.
5. The documentation can be useful historical data for any future endeavor. It provides inputs for better decisions on related situations in the future.
6. This can also be compiled and used to teach future new team members. "Learn from the past" it is said.
There are many more benefits. Mr. Schneider is very correct about his call to "put it in writing".
|
|
Sandy Montalbano
Consultant, Reshoring Initiative |
Posted on: Aug, 24 2016 |
|
U.S. companies are reshoring and foreign companies are investing in U.S. locations to be in close proximity to the U.S. market for customer responsiveness, flexibility, quality control, and for the positive branding of "Made in USA".
Reshoring including FDI balanced offshoring in 2015 as it did in 2014. In comparison, in 2000-2007 the U.S. lost net about 200,000 manufacturing jobs per year to offshoring. That is huge progress to celebrate!
The Reshoring Initiative Can Help. In order to help companies decide objectively to reshore manufacturing back to the U.S. or offshore, the nonprofit Reshoring Initiative's free Total Cost of Ownership Estimator can help corporations calculate the real P&L impact of reshoring or offshoring. http://www.reshorenow.org/TCO_Estimator.cfm
|
|
Robert
Transportation Manager, N/A |
Posted on: Aug, 30 2016 |
|
| Good article! I am sending this to my colleagues who work with me. We have to keep this in mind. Thanks! |
|
Ian Jansen
Mr, NHLS |
Posted on: Sep, 14 2016 |
|
SCM is all about getting the order delivered to the Customer on date/ time requested because happy Customers = Revenue. Using the right tools to do the right job is important and SCM is heavily dependent on sophisticated ERP systems to get right real data info ASP.
I've worked in a DC with more than 400,000 line items and measured the Productivity of Pickers by how many "picks" per day.
I've learned that one doesn't have to remind Germany about your EDI orders. |
|
Don Benson
Partner, Warehouse Coach |
Posted on: Sep, 15 2016 |
|
Challenge - to build and sustain effective relationships at the level of the organizations that are responsible for effectively coordinating and colaborating in an otherwise highly competitive environment
|
|
Jade
Admin, Fulfillment Logistics UK Ltd |
Posted on: Oct, 02 2016 |
|
| Of course we all need to up our game. We need to move with the times, and always be one step ahead of what the future will bring. |
|
Mike Dargis
President of asset-based carrier based in the Midwest, Zip Xpress Inc. (at ZipXpress.net) |
Posted on: Oct, 03 2016 |
|
Thanks for the article, but I know there's a lot more to this issue than just the pay rates. Please check out my blogs on the subject at www.zipxpress.net.
|
|
Blaine
Inventory Specialist, Syncron |
Posted on: Nov, 16 2016 |
|
Lora, great article! I agree that companies choose the 'safe' solution more often than not. My solution is a bolt-on for legacy ERP's and we even face challeneges of customer adoption. Most like to play it safe and choose an ERP upgrade, which is more costly, time consuming, and has lower ROI across the board. Would love to learn more about your company, we are always looking for partnerships.
Blaine
blaine.schultz@syncron.com
|
|
Bob McIntyre
National Account Executive, DBK Concepts LLC |
Posted on: Nov, 21 2016 |
|
| This is a game changer in GE's production and prototyping. It also has huge implications across the GE global supply chain with regard to the management of their support and spare parts network. |
|
Kai Furmans
Professor, KIT |
Posted on: May, 22 2017 |
|
I am referencing to the comment that leasing of warehousing equipment (beyond forklift trucks) is a vision for 2030.
Just recently in Europe, such a business model has started, see here: https://next-intralogistics.de/
I am following with a lot of interest, how the business develops.
|
|
Stuart Rosenberg
Supply Chain Consultant, First Choice Supply Chain |
Posted on: Jun, 05 2017 |
|
If we limit the standard on judging or determining the best supply chain to just three calculations it does not tell the entire picture. Financial performance metrics are valuable as they capture the economic consequences of business decisions. But supply chain managers make decsions and use organizational resources that impact a company's financial well being. Where is a firm's earnings over a period of time determined by sales less product costs and general/adminsitrative costs? Where is the metric for determining the sources and uses of cash from three perspectives - operational, investment and financial? Where are these supply chain metrics: on-time delivery, lead time, response time to customers, product returns, procurement costs, network distance, inventory carrying costs, forecasting accuracy, sourcing time, etc,. Without knowing the results of all these supply chain calculations the there must be a question as to the accuracy of the 25 top supply chains.
|
|
Dustin Calitz
Project Commercialization Manager, Mondelez |
Posted on: Jun, 06 2017 |
|
| I feel this ranking misses the mark in SC. It does not seem to consider a key indicator in days inventory on hand, which is key to determining a SC company's ability to forecast, manage inventory costs and reduce aged stock. In additiion I realize it's difficult to understand what goes into the customer survey, but would I assume specific metrics are being asked. For examples customer's opinion on service level differentiation and the ability to deliver the right product on time, which should then be allocated a bigger weighting than 10%. It would also be interesting to take a view of the above list's SKU portfolio complexity, seasonality and launches/promotions. I would again assume some companies on the list above have a far more complex SC to manage and lead, ultimately requiring a lot more innovation within a SC to stay ahead of competitors, and ultimately satisfy their customers demands. I understand above metrics are difficult to measure, as mentioned in the article, but they somehow need to be considered to give a true reflection. |
|
Michael Hurd
Lean Consultant, Unemployed |
Posted on: Jun, 10 2017 |
|
A Very Good Article...
While some feel that lean is a scam that pushes for more out of the personnel and out of the companies through reduction of waste and adding value for the customer, there are several things to remember:
1) Lean methodologies are designed and implemented to reduce time wasting, so this may seem that you are working harder as an employee.
2) Lean methdoligies only work when everyone from the janitor to the owner of the company get involved and back the program.
3) Lean methods are there to make you work smarter not harder, although it may feel you are working harder.
4) YES... Sometimes lean methodologies fail! This is due to project overun or taking on too large a problem and trying to fix it all in one go and not taking the smaller problems that are associated with the large problem and fixing them first. Sometimes fixing the small problems leads to resolution of the larger problem. |
|
Akhil
Director Supply Chain , skuchain |
Posted on: Jul, 31 2017 |
|
The Supply Chain technology is not considered a problem because traditionally supply chains are thought to be cost centres unlike sales functions. The tendency, in general, to limit expenses and cost cutting on upgrades for technology and for talent have been hindering progress for the businesses. Supply chains lack real time visbility and above all trust across the value chain (not that the participants are dishonest) rather it's about the cascading effects referred to as the bull-whip effect which causes higher magnitudes of disruptions.
Supply chain real time information should top the list .
Another problem is that of multi homing as so much data is available across several feeds of IOT/Email/Internet /Mobility/ERP that organisations tend to have issues around finding a single platform to collate them for meaning analysis.
Blockchain (if deployed appropriately) can be a great solution for solving the issues around the supply chain.
|
|
Mike Ledyard
Vested Program Faculty, Vested Way / University ofTennessee |
Posted on: Aug, 04 2017 |
|
| Excellent article. It very much points to the need for Shared Risk / Shared Reward as we teach at Vested. Suppliers will respond when they are made part of the team, and they have a lot to bring to the game. The service provider is the subject matter expert in the services provided, and in an excellent position to enhance the capabilities and services offered by the shipper. |
|
Andrew Downard
Managing Director, AD Supply Chain Group Pty Ltd |
Posted on: Aug, 05 2017 |
|
| As the article points out it is not a lack of technology that is holding back performance but rather a failure to form the right sort of relationships. As well as the length of such relatiohships, practitioners should consider employing arrangements that incentivise both parties to innovate and deliver levels of performance and profit that neither thought possible. By far the best model I have come across to achieve this is the Vested Outsourcing model developed by researchers from the University of Tennessee. See www.vestedway.com for information on the model and case studies that show how others have benefited from creating a Vested deal. |
|
Najma
logistics, threelineshipping |
Posted on: Aug, 23 2017 |
|
| Very informational article. The major focus of logistics is on e-commerce. There is a need to optimize every component of logistics by following the latest trends and technologies. Thanks for uploading this article. |
|
Sameer Shukkla
Consulting Partner, Wipro Inc. |
Posted on: Sep, 17 2017 |
|
I have recently co-authored a white paper with my colleague wherein we have looked at 2 fundamental guiding principles -
1. Always have enough to Sell / Produce
2. Do not have excess to Sell / Produce
These 2 Golden Rules can be the foundation of keeping optimal inventory levels and for organizations to achieve the same. We have looked at a framework which tries to reduce the phase mismatch between Demand & Supply, and tries to bring the shape of the supply curve closer to shape of the demand curve.
We have classified symptoms and underlying root causes for the above "Phase mismatch" and "Curve Mismatch" between Demand and Supply, and then talked about addresssing those individual root causes to strive towards Leaner Inventory levels while maintaining or improving service levels.
So to answer your question, we feel the Companies which have addresed these causes have been able to keep DIO horizontal or even going down, while others have not been able to control rising DIO because of not addressing the root causes.
|
|
Simon Eagle
SCM Consultant, Camelot MC |
Posted on: Sep, 17 2017 |
|
You ask why turns are flat or declining despite lots of attention and technology. The answer is, I think, 2 fold: the supply chain environments VUCA (Volatliity, Uncertainty, Complexity, Ambiguity) is on a continuous upward curve and this means that forecast accuracy inevitably declines in parallel - and much of that inaccuracy is hidden by the statistics. For instance a company with, seemingy good, 80% mix accuracy will find that figure is skewed so high by the few high volume / low variability items. 80% of the items will be achieving considerably less than 60% error.
So most item level forecasts used for driving replenishment through an MPS (be it ERP or APS) are simply leading to unbalanced stocks, service threats and continuous expediting / fire-fighting. These schedule interrutions are "variability" that is disrupting flow and, thereby, increasing lead-times, using unplanned capacity and generating excessive (and still unbalanced) inventories.
The replacement in ex-stock supply chains is "enterprise(s)-wide" pull which also uses "push" for extreme/exceptional events. Its other key characteristics are that the supply chain is decoupled and is demand-driven. And now it can be implemented using SAP since they announced they they have co-developed an enhancement for IBP that supports this transformational way of working - up to 50% inventory reduction, requiring less capacity and shorter lead-times all while achieving planned service levels. See https://www.camelot-itlab.com/en/camelot-demand-driven-lean-planning-suite-for-sap/ and https://www.linkedin.com/pulse/supply-chain-flow-what-why-how-simon-eagle/
|
|
John Smith
Research & Development, Octopus Tech Solutions |
Posted on: Sep, 18 2017 |
|
| IoT is without a doubt starting to become a major factor in the profitability of various companies. In the manufacturing sector, we will see it come into the front by the end of 2020 completely. Various sectors have already adapted IoT solutions like the security industry or companies offering BPO Services India. Contact centers not just in India and China but across the world have adapted technology following the principles of IoT. The manufacturing sector is soon going to follow. |
|
Girish Maniyar
Chief Manager Development Initiatives, Asian Paints |
Posted on: Sep, 28 2017 |
|
I can speak with some context. While efficiency and tools can reduce inventory, we also see the number of SKUs and new products increasing, and also the number of sales/depot points. This means the inventory in such cases, can start with very high number and with more customization and choices available to the consumer, so there is no end to the long tail of products available within a category. It is unlikely that the slow/dead goods are written off so easily to be not included here.
A larger question, would it be purely an IO problem or also a Demand Planning (Forecast Error) problem? A higher cycle time of service but a better fill rate can improve inventory performance, by aggregation. But a bad forecast can do away all the good work you do in inventory planning.
Do you have numbers for decorative coatings in the list? I did not see something there only for decorative coatings.
|
|
Reo B Hatfield
Chief Operating Executive , BestTransport |
Posted on: Oct, 20 2017 |
|
My opinion is that peaks and valley are just nice graphics to explain. Smooth responses save the day. 3PLs just adjust to the climate and the areas of movement of Logistics. One purpose of the 3PL movement was to adjust to an always changing market. They will never be fixed and will flex as the logistics changes. 3PL companies have vast knowledge of their business. Their success is their ability to move up and down as the market flows. They bring a level playing field to the transportation world that in the past was rigid but looked good on spreadsheets. Industry graphic personnel like to be able to answer all the changes because they can only see documents. 3PLs see the needs, the issues, the positive changes and the knowledge to know why and when to adjust. They (3PLs) have smoothed the waves of the past and everybody likes to see the spikes so they know something is there to clearly report on. Smooth sailing is boring but sure gets you where you want to go.
|
|
Catherine Dennis
Supply Chain Manager, Indak Mfg Corp |
Posted on: Oct, 26 2017 |
|
| So the horrific and severe worldwide allocation of electronic components is not an issue? Don't tell that to the automotive buyers. It's HORRIBLE. Lead times out to up to 76 weeks. Why not write about that? It's killing us, our customers and the big automakers. |
|
Huub
Logistics Manager, Shell |
Posted on: Nov, 11 2017 |
|
| I suggest McKinsey to do a bit more research in Prof Gattorna’s dynamic alignment. This article only scratches the surface a tiny bit. Much more to be found reading about the alignment concept. |
|
Joseph George
Farmer, Field Vista |
Posted on: Dec, 07 2017 |
|
| Primarily Vision is required followed by Assigned Focus on objectives. Or maybe just love for USA. The market will not find its way unless it's for organic vegetables and RRR. Two to three years later will take two to three years longer to the end of the decade, and this is viable today. God bless america from its present distraction. |
|
Gary Buchs
Owner Operator , Self, Landstar Business Capacity Owner |
Posted on: Dec, 17 2017 |
|
In My Opinion, the fact that capacity will tighten should be obvious to everyone engaged in the transportation.
Capacity to move freight isn’t how many trucks or trailers are in the system or what a computer
program says, it still is truck driver based and poorly-managed companies won’t be able to imporove
this fact. Investing in people is still most important!
Get ready to pay higher prices for goods and services. I think we could lose 10% of Capacity in many areas.
|
|
Dan
Pres., Bioptechs |
Posted on: Dec, 20 2017 |
|
| After all the ground we have lost in the productive sector and the additional burden that loss of our productive momentum has placed on our society, somebody tell me why so many people are against the actions necessary to restore our vital productive infrastructure! It is like the left enjoys shooting itself in the foot! |
|
Jayaram
Business Development, Raghava Logistics |
Posted on: Mar, 04 2018 |
|
Great article and thank you for summerizing the predications.
What does it mean to country like India where the labour is still cheap? Where the logistics cost is still on the higher side compared to some of the developed nations?
|
|
Herb Shields
President , HCS Consulting |
Posted on: Mar, 06 2018 |
|
I agree that robots can replace some amount of manual labor in logistics centers. However as you mention, the labor pool is shrinking. We need more training programs such as the one provided by the Greater West Town organization in Chicago. Www.gwtp.org. (It is a program that your readers should find interesting.) |
|
Billy
Associate, BJO |
Posted on: Mar, 13 2018 |
|
Thanks for this very informative article.
|
|
Doug Murless
Country Manager, krunchbox (www.krunchbox.com) |
Posted on: Mar, 18 2018 |
|
Gone are the days when consumers will wait for a retailer to have the product back in stock, those days are done. We live in the "I want it now" society and with Amazon in their pocket consumers can easily "now" it to themself the next day right from their phone.
The importance of product availability is under the microscope at all retailers as an empty shelf equals lost customers, a poor customer experience and entirely abandoned purchases.
We are on a mission at krunchbox to help suppliers fix their product availability and sell thru and improve their buyer relationships, hopefully before their retail partner fines start rolling in and or we see more retailers close. |
|
NikhilSingh
Executive, Carmatec INC |
Posted on: Mar, 21 2018 |
|
You are correct There are government programs to encourage investment at small and mid-size manufacturers, but McKinsey says these programs generally have smaller budgets, less certainty of ongoing funding, and more constraints on their mandates than comparable programs in other countries. Policy makers should examine which existing initiatives are producing the most promising results, then scale up those efforts and commit to them for the long term.
|
|
|
|
Chuck Nemer
Trainer, The Guru of Biz |
Posted on: Aug, 16 2019 |
|
Nice metaphor and nice picture. I'd like to see a bit more meat on the bones if you're going to completely sell me on the concept.
|
|
Charles Quail
CLO, Belair |
Posted on: Jan, 20 2020 |
|
The truth from the road is that rates were so good, that 2018 was the best year we had since 1997. So as we saw this happening, we saw carriers increased their fleets to capitalize on this gravy train, thus depressing the rates for 2019 from overcapacity. They also flooded the used truck market, and sales dropped 70%.
We know because we also were thinking of retiring, but cannot sell our lightly used 2019 Mack Anthem because of this. So we claim it was not the high cost structure, it was the greed. |
|
Tom Miralia
CEO, Distribution Technology |
Posted on: Feb, 26 2020 |
|
Multistory Bronx DC $700 million and 1.2 million sqft- what's the rent going to be- $3.50 per sqft per month? $40+ per sqft annually. In many metros, thats higher than the best Class A office rent and about 9-10 times a going rate in the suburbs? Well, space cost is the least cost in supply chain typically- still, must be a compelling business model to drive this?
Let's pretend that a product is valued at $50 a case, 60 cases per pallet, maybe stored in rack at 8 sqft per pallet in a narrow aisle single-select layout of some form- if total logistics expense ranges 8% maybe, then there's $240 in budget to flow goods from sourcing to customer. Now the retail customer may spend more to get it to the end purchaser which is beyond my scope (and may folks ability to truly model I suspect). if that pallet occupies that rack spot for 2 months that rent expense might range about $56? That takes almost the whole budget for warehousing portion of logistics costs before labor, equipment, admin, materials and so on?
I dunno if I'm seeing this right? Likely I'm off base?
|
|
Peter
Sales, Freight sales |
Posted on: May, 08 2020 |
|
From a sales prospective: Our company only uses small trucking companies and gives them the business directly. We sell right to the manufacturer. The companies we sell for have no sales force and are good hardworking companies who would usually have to rely on only brokers. We help them with appointments billing bids when needed. This year despite our companies doing an excellent job and not raising there rates we lost many accounts or were reduced significantly to brokers. |
|
Harry Moser
President, Reshoring Initiative |
Posted on: Sep, 24 2020 |
|
Mr. Meidinger is correct that high healthcare costs have hurt U.S. mfg. He overstates his case by describing healthcare as the primary cause:
- U.S. healthcare costs % of GDP are about 7 points higher. Our mfg. costs are 20 to 40% higher.
- The costs paid by taxes in the other countries require highrer salaries and selling prices to obtain the same after tax benefit.
- His graph shows correlation, not causation.
- For a clear comparison of the impact of various factors, see the Competitiveness Toolkit https://reshorenow.org/search/. We include lower healthcare costs as one of several important factors in driving further increases in reshoring.
|
|
Chris Imamura
Executive in Residence, University of Colordao |
Posted on: Oct, 10 2020 |
|
| You note that 28% of Amazon's operating income came from its AWS web services unit. However, from their 2019 Annual Report, Amazon reported $9.2B of the total $14.5B operating income came from AWS = 63%. What am I missing?
|
|
Robert Simoneau
Consultant, PolyEd |
Posted on: Oct, 13 2020 |
|
| This is an excellent article but a few more details would help. As a lecturer for the Society of Manufacturing Engineers spent a lot of time working with and teaching Tier suppliers. The stories they told were grim from two perspectives. First US automaker are slow to pay their bills, net whenever. The second is the timeline to pay for tooling, some claimed it took one year to get paid. As one group said we spend most of our time hiding money. I consulted for one of the big three and when I asked a group of managers and engineers, when do you pay your bills, they all laughed in unison ... big joke. I was furious and tried to explain to them how this affected their supply chain. It took a lot of effort for GM to go from 50% market share in the 50s, to less than 20%. When doing thier financial analysis they forgot about quality related issues and the eventual loss of market share. Interesting Boeing is doing the same thing with pretty much the same result ... sad. |
|
Jerry Saltzman
Professor, Zicklin Business School, Baruch College |
Posted on: Jan, 24 2021 |
|
After all the rhetoric and bluster, it's great to see a data driven the year in review analysis. it was certainly a wild year but the data shows the resilience of the global and domestic supply chain despite political interference and Policy by tweet.
|
|
Dave
Individual, NA |
Posted on: Mar, 15 2021 |
|
How come SPSC, SPS Commerce isn't included in supply chain software?
|
|
Steve Murray
Senior Analyst, Warehousing Education and Research Council |
Posted on: Apr, 07 2021 |
|
| From 1967 to 1972 I worked as a business systems analyst and developer for Safeway Stores, Inc. At that time Safeway was the largest grocery retailer in the U.S. based on revenue. It was also highly unionized. While Safeway supported the efforts to develop a machine readable code for retail checkout, it's relationship with the union kept it from doing so openly as it might reduce the need for price ticketers, and checkers. Quite frustrating for those of us who were developing solutions. But back then we had plenty to do working on accounting systems, procurement, warehouse inventory control, retail store replenishment and labor planning - after all this was the dawn of the retail supply chain. Eventually Safeway signed on to the UPC movement and the rest is, as you say, history. |
|
AL WEISS
CHAIRMAN, WEISS SUPPLY CHAIN CONSULTANTS |
Posted on: Apr, 09 2021 |
|
| GREAT ARTICLE! |
|
Rick
supply chain manager, Fresh Mark |
Posted on: May, 28 2021 |
|
| Do you have any information about Hormel's supply chain? |
|
Daniel Druwe Araujo
CPIM, CSCP, T2People |
Posted on: Jun, 04 2021 |
|
Very appropriate article, explaining the non-qualitative ranking, at least from a Supply Chain Management perspective.
Once understood what it is not, the ranking is very interesting in terms of identifying the most successful companies in absolute terms.
The question that remains for the professionals interested in learning from the best supply chain designers and managers is exactly which are the most useful ideas and practices that can be learned from the best companies. |
|
Terry Haider
Owner, TC Haider Group |
Posted on: Aug, 18 2022 |
|
| We were one of those contractors who failed in year 1 due to inflation in costs & FedEx not being willing to renegotiate our contract. There was absolutely nothing we could do to be cash flow positive with paying acquisition debt so we ceased operations on June 30. I know of another contractor in our smaller terminal who also has been in business several years who doubted he'd make it to peak. This is a serious problem & if FedEx doesn't get a handle on it soon, their Ground network is very vulnerable & the reputation damage to the business model will stop anyone with a brain from buying in (I obviously didn't and I have an MBA in finance but could not cover the impact from fuel cost & labor cost escalation from my original forecast - mostly fuel cost). Sorry I ever got involved. I won't recover financially from this loss over what is left of a potential finance career from my experience. I counsel colleagues to stay the hell away. FEdEx is not a real partner in this with their contractors. |
|
Asher Rapp
None, None |
Posted on: Aug, 24 2022 |
|
| I find it interesting that the company making all these assumptions and graphs is one of the leading underwriters in alternative investments Carbon related funds. |
|
Rosemary Coates
Host, The Frictionless Supply Chain Podcast |
Posted on: Sep, 28 2022 |
|
| I would love to interview someone from Schneider about this initiative. My podcast highlights women in supply chain management and is hosted by Supply Chain Management Review. Please contact me at rcoates@ReshoringInstitiute.org |
|
Mike Loughrin
CEO, Transformance Advisors |
Posted on: Oct, 13 2022 |
|
The dramatic fall in ocean container shipping rates is just another sign we are seeing a massive bullwhip effect coming. Other indications are early sales for Christmas items as retailers have too much inventory. Sales on new cars because the dealer lots are full. Sales on bicycles after a period of severe shortages.
We are going to see how many supply chian people over-reacted to the constraints during Covid and now need to deal with excess inventory and capacity.
|
|
Mike Albert
VP Business Development, N/A |
Posted on: Mar, 15 2023 |
|
| I'd suggest that Adrian Dalsey, Larry Hillblom, and Robert Lynn should be considered for induction. They revolutionized the international trade business by devising a process of fly Trade / Clearance documents to speed clearance of international shipments. They also happen to be the founders of DHL. |
|
Nick Seiersen
Title, Company |
Posted on: Mar, 17 2023 |
|
AI and ML are indeed intruiging developments of information technology. My understanding is that Machine Learning happens when the system weeds through reams of information and identifies high probability correlations, and infers a relationship of causation. This is extremely dangerous. Think back a century. Men who wore top hats rarely died in poverty. Would a policy of giving out top hats to the poor have been effective? Yet the data would have recommended it.
The case of the chips you give is one of supervised learning. The situations are scored by an expert. When the system encounters another situation, it assesses the characteristics, and makes a determination.
This is all brute force computation, hashing through massive amounts of data and scoring correlations (or data matches), and that is the basis for this "new" technology.
So if you have a solid base of massive amounts of high quality data that has been or could be scored, AI tools (i.e. correlation) are a real option. Such as item level forecast/actual sales, associated with external causation factors.
The breakthrough of ChatGPT is associating a text generating capability as a front end to an inference engine (the massive language model GPT2 or 3). But it is still brute force correlation, hence the propensity for nonsense or what they call "hallucination."
Plain text makes the interface with the artificial intelligence system much easier - everyone knows how to ask a question. The quality of the question will impact the quality of the response, so solid systems understanding will still be a real asset.
|
|
Iris
Digital marketing, Vanhaigroup.com |
Posted on: May, 25 2023 |
|
Great article,I share the same sentiment regarding companies learning towards the safe option. I would be interested in learning more about your company, as we are continuously seeking partnership opportunities.
http://vanhaigroup.com/
|
|
Name
Title, Company |
Posted on: Jul, 13 2023 |
|
| The unions are freeloading off the backs of union workers and they don't care about the employees. |
|
John Smith
Road driver, Yellow |
Posted on: Jul, 13 2023 |
|
| Sean O'Brien is using Yellow freight as a pawn in the UPS and T-Force negotiations. He is willing to sacrifice 22,000 Teamster jobs to make his legacy known. He sounds all professional on the news but he was nothing but reckless and acting like a child when he sabotaged Yellow in the media with our customers. 22,000 households over a hundred thousand people not to mention all the folks that support our business that will cut jobs because of our closing. Folks with sick family members, folks who will lose their homes. Families are bankrupted by this. All while Sean is eating up his moment in the spot light. He probably goes home and replays the news broadcast so he can see himself. I don't know how he can look in the mirror at himself when he knows what he is doing to us at Yellow!!! |
|
Name
Title, Company |
Posted on: Jul, 13 2023 |
|
| Made my pension 17 years ago. Thanks its over. Good people work only for long term companies. |
|
None Provided
None Provided, None Provided |
Posted on: Jul, 13 2023 |
|
| It's time for the ceo to step down and yellow needs to be audited immediately. |
|
Name
Title, Company |
Posted on: Jul, 14 2023 |
|
| My question is how is it that a company like Yellow keeps buying other companies that were making money and shortly later they are broke. This is the same way ANR operated for years, then they want to blame the union for not making money.
|
|
None Provided
None Provided, None Provided |
Posted on: Jul, 14 2023 |
|
| As a former Holland/Yellow driver I saw what drinking the Yellow Kool-aid did to Holland. Holland was a great company to work for. They treated drivers with respect . Once Yellow bought Holland things changed. Management seemed against the union. Service got worse, customers only stayed for cheap prices. Negotiations in the last contract, Yellow had over 50,000 union employees. Today only 22,000 remain. Yellow got $700 million in a government bailout but instead of pulling up the boot straps and running a better machine they chose to give themselves bonuses. I ask how can that happen? Bonuses are for a job well done. What job was well done? In the last contract any bonuses must be shared with the union workers. Every Teamster got around $500 before taxes. Yellow has only paid back the taxpayers $230 on the principle but lots of interest over $50 million. It is time for Yellow to just go away. |
|
Name
Title, Company |
Posted on: Jul, 16 2023 |
|
| Since the merger they've managed to sell all Roadway assets to cover their costs and going for the last of them just to cover costs but somehow they managed to never have any money. Some people are so greedy all they think about is themselves, someone needs to be held accountable for where the money has gone, well you know Trump had a hand in this just saying. |
|
anonymous
clerk, one yellow |
Posted on: Jul, 18 2023 |
|
| First and foremost, one Yellow needs to clean house of those upper corporate executives including D. Hawkins. That in itself would free up a great deal of money. Next, reduce the corporate employee force and combine jobs, again, freeing up a great deal of money. There are too many corporate executives and assistance in the corporate office. Reduce the head count, combine the jobs and reduce the pay of those that are needed.
This is quite easy, since they did it to the teamsters way back when so it's time for pay back, so do it to them!
|
|
Big pappa
P&D, Company |
Posted on: Jul, 23 2023 |
|
| This one of the most devastating situations I have ever faced in 53 years of life. I'm angry and sad for the people, I love my co-workers and they are family to me and Yellow freight has destroyed my family.
I hope they have remorse, but upper management knew what they were doing 9 months ago, so it seems they set themselves up to fail?
They had no plan and no safety net, as long as you have a plan of some type you would think there is hope. I've been a truck driver 22 years and have never seen this kind of idiocy in my life. Basically Hawkins and his croneys took the money and ran, they knew what they were doing by lining their pockets with the American tax payers money. Now the American tax payer is going to take the hit by losing their money and paying higher freight rates and 22.000 hard working tax payers are going to lose their jobs with no insurance and little to no retirement.
I have brothers and sisters that have been with this corporation since they were in high school. They have been here for decades. Now they have no health or welfare or retirement, and for some it's time to retire. The big question is "now what". The Federal Government should take over this company and step in and clean house with federal charges against the guilty.
You can't tell me these people are not white collar criminals and nothing but.
They cant blame the IBT, we kept them afloat for alot of years.
|
|
danny
owner, richards enterprises |
Posted on: Jul, 26 2023 |
|
| Management at Yellow have ruined many other trucking companies they have bought. They now have done it to Yellow. Employees are lowest paid in industry they are not at fault.The CEO and other managment should have been replaced a long time ago. |
|
Benjamin Parkinson
Title, Local 881 |
Posted on: Jul, 28 2023 |
|
| I've been here for 5 years and every time yellow says they are going to do something it lasts a couple days then it's right back to the same way it was. They can't keep a terminal manager here long enough to fulfill their changes and promises, the work weather conditions are dreadful. It's either 10° hotter or -10° in temp change then outside, no climate controlled facility. I'm done with their game with teamsters by going bankrupt, oh now were not, oh now we are, now we're not. Make up your mind. Iv'e already have other plans that were in the making since Monday so they can lay me off because I'm sick and tired of the game. We get no answers no information till the last second. Now once again now we are at the bargaining table and we might not file bankruptcy. It's s joke, make up your mind right now. People it's over, all your customers have fled, you have no revenue, all your employees are gone, you failed as a company so deal with it and move on.
|
|
Tony Morrow
Title, Company |
Posted on: Jul, 30 2023 |
|
| Why Yellow bought Roadway, I'll never knew. Unless they wanted more bricks and mortar stations and equipment and hopefully a large part of Roadway's customer base. I was in the freight business for many years and this rarely if ever happens.
|
|
Mark Lilien
IT Director, Kleinfeld Bridal |
Posted on: Sep, 18 2023 |
|
| Many 7-Eleven stores have offered 30 minute delivery around the clock.
It is not too hard if the store uses DoorDash or a similar service.
|
|
Marc Wulfraat
President, MWPVL International |
Posted on: Nov, 07 2023 |
|
| The Amazon 2022 revenue figure of 117.716bb is directly off of their 10K statement where they provide supplemental financial information. This is the figure for all of their third party seller services which includes fulfillment services + shipping services. In point of fact the true transportation revenue component is likely in the 48.8bb range. Amazon used to report shipping revenue until Q12017 which was 2.5bb for the quarter and then they stopped reporting it. So one needs to extrapolate and estimate this figure which is how I arrive at the 48.8bb/year estimate. This transportation revenue is a far cry from the 100bb from UPS so I find this chart distorted. |
|
Paul Baddick
account manager, LD Systems |
Posted on: Feb, 29 2024 |
|
This article caught me by surprise. I cover the Eastern part of Penna. and I have seen move distribution centers being build all across Interstate 78 from Easton to Harrisburg and the 81 corridor from Harrisburg to Scranton.
|
|
Mat Woodcock
RVP, Supply Chain Strategy, Coupa |
Posted on: Mar, 01 2024 |
|
Thanks for sharing! The additional decision making dimensions Bain are suggesting align pretty closely to the conversations we've been having with our Supply Chain Design & Planning customers. The days of simply trading off the classic triangle of Cost/Cash/Service are behind us.
In terms of the Bain comment re: resilience being very expensive, and monitoring/recovering and flexible design being a needed capability, that you move on rapidly from in the article - my personal take on that is since it's realistically impossible to build a fully resilient supply chain. The focus switches to where do you focus your resilience invesment and design for flexibility (excess capacity, switchable manufacturing sites, non-optimal transport lanes, etc.) at a cost - albeit a known one, in the places where it provides the most benefit - which means when something happens you can switch the most critical elements. While at the same time investing in parallel in being able to see that event happening as early as possible and have the reactive process already established to know where and what you can switch (and critically the senior leadership alignment to press the button).
I believe it is David Simchi-Levi that coined the approach of increasing your time to survive (ie resilience), while decreasing your time to thrive (the processes and alternatives to get back on track). As long as you "thrive" before you run out of "surviving time" then you have enough resilience!
|
|
tom moore
partner, ProvisionAi |
Posted on: Mar, 22 2024 |
|
| Good article. The need to optimize loading while routing is an unfilled niche in the market -- but, based on your notes, I don't think they go there. Like all of us in load optimization, it looks like they do a post routing truckload build. Only then do you know if everything fits or if there is space. |
|
Thomas L Dadmun
VP SCM Retired , ADTRAN Retired. |
Posted on: Apr, 10 2024 |
|
It is important for SCM Profesionals to set up a heirarchy of KPI's based on their business. Soliciting input from the business is key but you need to benchmark your " Best in Class " competitors as well. This seems like a daunting task but most folks welcome the ability to share data as long as your willing to reciprocate as well.
Here's an example of a hierarchy that was presented in a past SC Digest video, an informative tutorial on how to develop one with your team and with your competitors. Good luck!!
 |
|
Bryan Jensen
Chairperson/EVP, St. Onge Company |
Posted on: Apr, 19 2024 |
|
| John will be greatly missed indeed. And from my perspective, it was John who generously kept working with us, as was his nature, completely, as you mention, without ego. We are so much better for having known him. |
|
Joe Nickence
General Manager, Dracowolf Enterprises |
Posted on: May, 07 2024 |
|
| This is something that is practiced from the smallest to the largest companies. Amazon simply got caught with their hands in the cookie jar. Once AGI and DAOs are in the wilds, this is going to compound. |
|
Steve Murray
Sr. Process Analyst, WERC |
Posted on: Jun, 15 2024 |
|
| Spot on Dan. I think that we, material handling suppliers and customers, are trying too hard to cover everything with the "AI" paintbrush. I think of AI as "Intelligent Automation", and as you say "not new age". There will always be cool new stuff and ways of using it, but I personally believe that we should look at the tools that are available, new and old, and understand better how to use them without thinkng that they will tell us. I like the old IBM adage "Machines should work, people should think". |
|
Steve Murray
Sr. Process Analyst, Warehousing Education and Research Council |
Posted on: Jul, 18 2024 |
|
| We have used "decoupled" processes for hundreds of years. We call them "Silos". I understnad the value of the flexibility in the Gartner modes, but I am concerned about the silo effect on both operations and most importantly data. |
|
Jonathan
Smith, Tata Consultancy Services |
Posted on: Aug, 05 2024 |
|
| Although Texas has three schools with undergraduate programs in the top 10, the states of TN, SC, & GA combined have a 20% smaller population while having three schools that outrank the three in Texas. So much for TX dominating the list. Go Vols, Gamecocks, & Jackets! |
|
Norman Katz
President, Katzscan Inc. |
Posted on: Aug, 28 2024 |
|
| Walmart's offering of LTL and TL services should help their vendors reduce supply chain vendor compliance chargebacks - financial penalties - that occur when shipments are damaged or late. Inasmuch as the vendor should not be penalized when using the retailer's carrier of choice, by using the carrier that is the retailer itself, this should further diminish the retailer's ability to charge the vendor for late or lost shipments when the shipment was picked up on time. This effectively moves the retailer's (e.g., Walmart's) responsibility for the goods closer to the point of pickup. |
|
|


