My column a few weeks ago on Walmart and Amazon by the Numbers 2017 once again proved very popular, with a number of readers emailing "give us more." That response, plus the fact that I have a lot of fun doing this, brings me back this week, with some additional data and charts.
Gilmore Says.... |
 |
| Doing the same calculation with Walmart but also subtracting the dividend leaves it with just $9.6 billion in free cash - just a bit less than Amazon realized even though Walmart had $346 billion more in revenue. |
 |
What do you say? |
|
| Click here to send us your comments |
| |
|
|
|
I will again quickly note that a few readers commented that my first column alerted them to the fact that you really have to dig into almost any numbers reported by someone to see if they make sense and/or understand what they really mean in context, as for example, in my unique analysis of Amazon's shipping costs as a percent of merchandise sales. I could write a whole column on this point - take few numbers at pure face value.
OK, to first put the numbers from both of my columns in perspective, let's first look at the rise of ecommerce. According to the Commerce Dept., ecommerce sales were about 8.1% of total retail sales last year, up from 7.3% in 2015 - but those total retail numbers include sales of cars, gas stations, restaurants and a few other categories that are not really relevant for comparison.
So, we compute the numbers based on the same formula we used in the last column to analyze Walmart's share of US retail, for which we take total retail and subtract out those non-relevant categories. Using that formula, ecommerce sales were a much higher 11.9% of total US retail sales in 2016, up strongly from 10.9% in 2015. Of course, that share is much higher in some product categories, such as electronics and apparel.
In my first column, we also graphed the annual percentage growth for Walmart's US retail sales, which have slowed noticeably in recent years. Below we show the Walmart numbers in absolute terms across its three reporting units: US, Sam's Club, and International. All units have seen the pace of growth slow sharply, and the recent big slowdown in international is a bit puzzling (though rise of the US dollar is clearly playing some role). Basically, Walmart's total sales are close to flat since 2012.
The cumulative average growth rate (CAGR) for each unit and total sales is shown beneath the chart. As you can see, Walmart has had an average CAGR of a pretty decent 4.46% for total sales from 2004 through 2016, but that clearly comes much more from the first half of that period than the last few years.
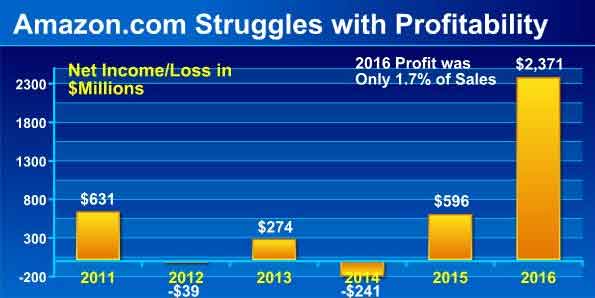
Switching gears, Amazon get much criticism for its consistent failure to really make any money, but it saw a relative big jump in net income in 2016. But basically for now it is a not much above a breakeven business, making a little or losing a little each year and quarter, as shown in the chart below, where the 2016 million profit was just 1.7% of sales. That was up from a margin of just 0.5% in 2015.
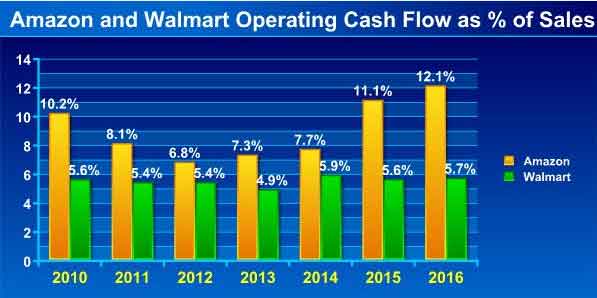
But others say look instead at Amazon's cash flow from operations, which paints a better picture, and indeed operating cash flow has recently risen to be more than twice as high as Walmart's as a percent of revenue, as shown in the chart below. Note, however, the consistency of the Walmart numbers, for good or bad. Wamart is what it is.
About $1.7 billion of the $4.5 billion in Amazon's cash flow from operations came from the increase in net income. Another $2 billion came from increased depreciation expense, a number that is added back into cash flow.
But there is operating cash flow and then what is called "free cash flow," or operating cash flow minus capital expenditures, and here the story is also interesting.
Amazon had operating cash flow of $16.4 billion in 2016, and had CapEx of about $6.7 billion, up more than $2 billion from 2015. So that means CapEX was 41% of operating cash flow, way down from a whopping 72% seen in 2014.
Walmart, on the other hand, had CapEx of about $11.5 billion, against $27.4 billion in operating cash flow, or 42% - almost exactly the same ratio as Amazon. (Note: as a proxy for official CapEx, I am using spending on real estate, equipment and technology). Importantly, Walmart, however, also has to pay a dividend from its cash flow- $6.3 billion worth last year - while Amazon does not. So Amazon's operating cash flow minus CapEx spend = $9.7 billion. Doing the same calculation with Walmart but also subtracting the dividend leaves it with just $9.6 billion in free cash - just a bit less than Amazon realized even though Walmart had $346 billion more in revenue. Wow.
In the first column I calculated Amazon's net shipping costs as a percent of merchandise revenue, which is more relevant than looking at that ratio against total sales, which include electronic media and services for which no shipping is required. It was a hefty number - 6.2% in Q4.
Now I am back this week doing the same thing for fulfillment costs - basically DC operations plus the depreciation expense for all those buildings and robots, and inbound freight, reported as a line item by Amazon. We calculated the ratio of that expense - which doesn't include shipping, by the way - again against merchandise sales, as shown below.
Wow, fulfillment costs of 18% of merchandise revenues
last year. No wonder Amazon struggles to make any money -
when do the savings from all those Kiva robots start kicking in? Add fulfillment and shipping costs together, and it's an amazing 24.2% of merchandise sales - against a gross margin of 35%.
I could do more, but think that's enough for awhile - unless convinced otherwise.
Any reaction to these numbers from Amazon and Walmart? Any other data you would like to see? Let us know your thoughts at the Feedback button or section below.
Your Comments/Feedback
|
|
Carl Rossi
Director, Global Nuclear Transportation and Logistics, Westinghouse Electric Company |
Posted on: Mar, 23 2017 |
|
Excellent analysis! Really puts into perspective the differences in the two companies and directionally where they are going. |
|
Stephen Wilson
Digital Supply Chain Analyst, Tompkins |
Posted on: Mar, 23 2017 |
|
| Another very interesting article and we invest a lot of time in similar analysis at Tompkins. One thing I would like to point out is the impact of FBA’s incredible growth rate on your results. FBA unit volume, by most accounts, grew between 60% to 70% last year and that has a disproportionate effect. When you look at fulfillment costs as a percentage of gross merchandise value (GMV – the full value of merchandise sold through Amazon) the ratio is much closer to 10%. Amazon only reports as revenue the 30% or so of commissions and fees earned on an FBA fulfilled unit. But that ratio of 10% over 30%, or about 33%, is what skews fulfillment costs to 18% of the retail revenue Amazon reports in their financial statements.
When you add 10% fulfillment to the 8% to 9% of GMV that they spend on delivery, Amazon has a supply chain that can compete on efficiency with most in-store supply chains even before accounting for the added value of delivery to the home, orders of magnitude more selection, and that they recoup over half of their delivery cost in delivery revenue – mostly through an allocation of Prime membership fees.
Editor's Note
Yes, I am aware of this issue, but Amazon just doesn’t break out the numbers – even though they do a great job of detailing numbers – on FBA in enough detail to run the numbers.
Also, Amazon says that the costs for Amazon prime shipping are included in the fees charged to FBA clients. So are those fees separated and put into the shipping revenue bucket that is reported? ppinYou imply yes, would say that isn’t completely clear.
The reality is Prime is a loss leader. Using shipping as a loss leader is a somewhat recent idea. Obviously, it is a key factor in the tremendous top line growth. I have no doubt Amazon is “relatively efficient” – maybe even the best – but it has busted the paradigm in terms of not recouping directly fulfillment and shipping costs to drive growth and gain share – at the price of low/intermittent profitability.
That said, the upswing in cash flow seems to me quite a story.
Dan Gilmore
|
|
|


