Since 2005, I have been doing reporting and analysis on company and sector inventory levels based on the annual Working Capital scorecard that is compiled by REL, a division of the The Hackett Group.
It is always one of our most popular columns of the year.
Gilmore Says.... |
 |
| Among the 584 product companies SCDigest analyzed, average DIO was up in 2015, at 87.4 days, versus 83.0 in 2014, for an increase of 5.3%. |
 |
What do you say? |
|
| Click here to send us your comments |
| |
|
|
|
Once again this year, REL has been kind enough to send me the data set for some further analysis. The just released 2016 data is based on year-end 2015 financials from some 1000 US public companies.
It is great stuff, but the big value-add SCDigest performs here is to re-sort individual companies into new categories, so the categories and comparisons in our view are more usable for supply chain thinking. For example, in the original REL data, home builders like Toll Brothers are mixed in the household durables category with companies like Whirlpool. That is one of the most blatant "apples and oranges" combinations, but there were a number of others that don't jive, at least from a supply chain perspective. Metal producers such as US Steel were in the same category as miners, while "spirits" beverage companies are in the same category as soft drink companies, when the inventory dynamics of each group are dramatically different, in two of many other examples.
So, we do the (really) hard work of first eliminating sectors that aren't useful for the supply chain (e.g., bankers, etc.), and then redefining and populating the categories in a way that makes more sense for comparisons. As another example, rather than having one giant category of all specialty retail, we break that down into apparel, department stores, auto parts, etc. It really does take a lot of time.
It is far from perfect. Should Johnson & Johnson be placed in the pharma group, the medical device category, or consumer packaged goods, as it is in all those segments? Is Honeywell in the aerospace or automotive sector, or one of the "industrial conglomerates" like GE or 3M? That's where we put it again this year. There are many such examples where the call is not obvious.
In the end, we simply made choices, including looking up more details on a number of companies with which we were not familiar so they could be placed appropriately.
The other thing we do is add in companies for whatever reason are left out of the REL data set. Mysteriously, for example, retail giant Lowes is left out of the data every year. We go to Yahoo Finance, collect the data and do our own calculations for Lowes and about 30 other companies in total we think are worth adding in, including Nike, Dillard's, Conagra, Energizer and many more.
The full report and data set looks at three components working capital, changes in which of course directly determine overall cash flow: Days Sales Outstanding (DSO), Days Inventory Outstanding (DIO), and Days Payables Outstanding (DPO). Here, we are going to focus on just the inventory component.
Until last year, REL calculated DIO relative to how many days of sales a company held in inventory. That generated many complaints from readers, as the divisor in the formula was a day's worth of revenue, not a day's worth of cost of goods sold. As I said each year, that's how REL reported the data, and that's how thus had to deal with it.
But starting last year with the data for 2014, the DIO calculation was changed to:
End of Year Inventory Level/[Total Cost of Goods Sold/365]
So, you calculate the average cost of goods sold for one day, and then see how many of those COGS days you keep in inventory (based on year end balance sheet numbers).
As such, DIO is sort of the reverse of inventory turns, in that a higher DIO, all things being equal, means poorer inventory management performance, while a lower number signals improvement. You are being more efficient with inventory versus a given level of COGS.
So, let's take an example. Nike had cost of goods sold of about $17.4 billion in 2015, and had year ending inventories of about $4.8 billion. So:
$4.8 billlion/($17.4 billion/365)=DIO of 101.4 days
Apple, by contrast, has a DIO of just 6.5, while consumer products giant Procter & Gamble has a 2015 DIO of 56.7; medical device and supplies maker Baxter Int'l had a DIO of 114.8.
That DIO of 114.8 for Nike translates into about 3.6 inventory "turns," a more common measure in the supply chain (COGS/inventory) than DIO. With the change in the REL methodology last year, I can now translate all the DIO measures into turns, which was not possible before because using revenue not COGS each company's gross margin percentages were different. Will do that turns conversion next week.
In the US economy, overall inventory levels have been ticking up in recent years. As seen in the chart below from the Commerce Dept., the "inventory to sales" ratio (inventory levels divided by a month's worth of sales) spiked in late 2008/early 2009 as the recession caught companies with way more inventory than needed versus suddenly shrinking demand. But most companies cut away at that inventory ruthlessly, so that inventory was back on the longer term trend line by early 2010.
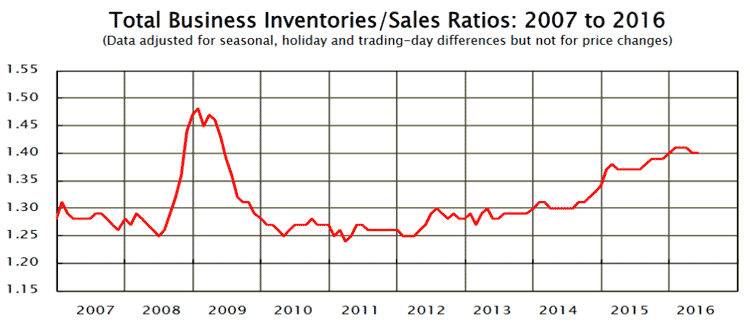
But since early 2012, inventory levels have headed slowly but consistently back up. The ITS of 1.40 recently is up about 12% from the 1.25 ratio seen at the start of 2012. The trend has been especially up in the retail sector, which has lately started to do something about it. As we reported recently, for example, Home Depot has plans to grow sales by 15% by 2018, and intends to do so keeping inventory levels where they are now, which would be a major change in how retailes have historically managed inventory versus sales growth.
Now, back to the REL data.
Among the 584 product companies SCDigest analyzed, average DIO was up in 2015, at 87.4 days, versus 83.0 in 2014, for an increase of 5.3%.
As a side comment, one thing that is really striking in doing this work across years is seeing how concentrated so many US business sectors have become. Office products retailers? We're went down to two a couple of years ago, after Office Depot swallowed OfficeMax, and that would have gone to one if the government had not blocked Staples from acquiring Office Depot this year. Molson Coors stands alone in the Beverages - Beer category, the only public US brewer left. Food distribution companies saw Spartan Foods acquire Nash Finch (now its SpartanNash) while again the government blocked the merger of Sysco with US Foods (the latter of which was taken private and is no longer in our list - same with Safeway, spirits maker Brown-Foreman, and more).
The companies per category simply shrinks every year - not good in my opinion.
So all that doesn't leave me much room here. Next week, I will publish the full analysis across about 65 sectors as SCDigest has defined them. Below, some highlights:
Top 5 lowest DIO sectors: (1) fast food restaurants: 7.9; (2) retail convenience stores: 8.7; (3) airlines: 10.7; (4) hospital chains: 12.0; (5) other restaurants: 12.7
Top 5 highest: (1) biotech: 348.0; (2) tobacco products: 294.6; (3) retail auto parts: 235.8; (4) pharmaceuticals: 220.1; (5) beverages - spirits: 199.6
Other notable sectors:
• Food Manufacturing:58.5
• Chemicals and Gases: 79.2
• Apparel and Shoe Manufacturing: 122.4
• Mass Merchants and Dept. Stores: 87.5
• Consumer Packaged Goods: 66.2
• Computers and Peripherals: 66.0
I'll save the rest for next week, including what sectors have had the best improvement. Good stuff. Would love your thoughts.
Any reaction to this inventory data? Why have inventories been creeping up on the past 5 years? Let us know your thoughts at the Feedback section below.
Your Comments/Feedback
|
|
Edward F Dunlap
CFO, Trojan Battery LLC |
Posted on: Aug, 04 2016 |
|
Interesting findings. What was the DIO for the Electrical Components and Equipment sector?
|
|
|


