 |
SUPPLY CHAIN NEWS BITES
|
What are the Trends in Global Energy Consumption by Source?
|
|
 |
Tesla Seeks Help from Vendors for Cash Flow Woes
|
 |
UPS Sees Strong Parcel Rate Growth |
 |
We are Consuming Earth's Resources at Record Clip, Group Says |
 |
US Freight Shipment Expense Soars in June |
| |
|
|
|
|
|
|
|
Walmart and Amazon by the Numbers 2018
For several years I have been doing some analysis and comparisons between Walmart and Amazon, that the two most important retailers in the world.
Walmart earns that place due to its stature as the world's largest merchant (and company) and one that represents an often substantial share of many consumer goods companies' total sales. Amazon obviously earns a spot as the dominant ecommerce company - at least in North America and Europe - and e-commerce is where all the action is right now, sucking most of the oxygen out of the retail room.
Amazon's actual or potential threat to a growing number of retail sectors is almost existential, and it is taking that to ever more sectors, such as drug stores/pharmaceuticals with its recently announced acquisition of on-line pharmacy Pillpack.
You can make an argument I should throw China's Alibab and maybe even JD.com into this mix as other ecommerce giants - maybe next year. They both remain China centric - for now.
Amazon continues its phenomenal growth, hardly even slowing down in the face of the law of big numbers. In news just last night, Amazon's Q2 2018 revenues were up 39% to $52.8 billion, while profits soared to $2.53 billion. Wow.
| GILMORE SAYS: |
Though not reported, I am sure shipping still is a big loss leader for Amazon, probably several billion dollars per year.
WHAT DO YOU SAY?
Send us your
Feedback here
|
So we've been looking at both of these retail giants "by the numbers" in recent years, and it has become one of our most popular columns of the year, forwarded by many SCDigest readers to others in their companies.
But as I will explain in a second, getting your arms around the numbers is often harder than you might think.
What Walmart and Amazon are doing is obviously of interest to most other retail and consumer goods manufacturers, and I hope others as well, as in the end almost every company is connected to the retail supply chain.
So let's start with Walmart, based on its its full fiscal year 2018, ending this past January.
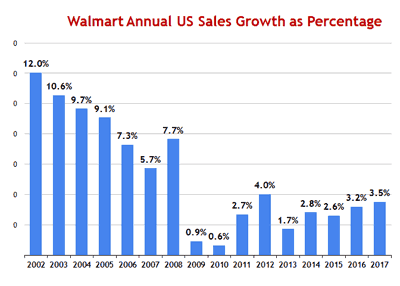
While Walmart is an incredible giant, its growth has slowed dramatically in recent years- though somewhat now on an uptick, driven in part by the strong US economy. As can be seen in the chart below, Walmart's US sales grew very rapidly in the beginning years of the 2000s, primarily by adding new superstores carrying groceries at a rapid pace into new markets.
But that growth soon decelerated, and in the recession year of 2009 started a pattern of mostly very low growth (2012 exception) that is not much above inflation on average, meaning real growth was almost flat or up a percent or so at best. But the news is better in the past two years.
Total Walmart US sales (Walmart US + Sam's Club) reached $377.7 billion last year, about double the $188 billion the company had in 2002, but the pace of that growth has obviously slowed substantially down. The Cumulative Average Growth Rate (CAGR) has averaged 4.77% since 2002, but has slowed to 2.87% since 2010.
See Full Image
|
Walmart's international growth continues to plateau, despite an awful lot of attention and investment there. Walmart international sales last year were $118.1 billion, up just 1.7%, after a decline in 2016. International is clearly not the Walmart growth engine once imagined.
Walmart still doesn't provide much detail on its ecommerce numbers, but it says it saw 44% growth in on-line sales in the US in 2017.
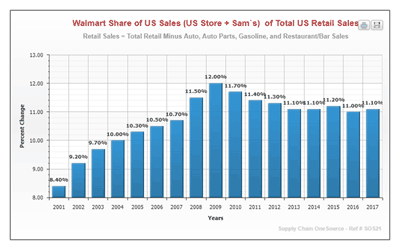
Not all that many years ago, there were concerns (I think legitimately at the time) about Walmart gobbling a giant, monopolistic share of the US retail market. That fear has simply faded. With the recent very modest sales growth, Walmart's share of US retail has flatlined. SCDigest developed a methodology several years ago, where we compare Walmart's US sales versus relevant US retail figures - total retail minus autos and parts, gas station and other fuel sales, and restaurants/bars.
It's not quite perfect because Yes Walmart does sell some gasoline, but it doesn't break it out in a way we can use. Nevertheless, I think what we have is pretty good - and does reflect a higher share of US retail for Walmart than if you do not exclude those categories, which is how it is usually reported. When you hear all these numbers, make sure you understand how they are calculated.
By our measure, Walmart had an 11.1% of US retail sales in 2017, basically flat over the past 5 years, and down from a peak of 12% in 2009. It simply does not appear any more that Walmart will take over the retail industry. That is an interesting and important change - and its share seems unlikely to go much higher to me, absent an acquisition. Would the FTC now let Walmart buy say Kroger or CVS? Hard to say. |
|
Now let's turn to Amazon, a company that provides a lot of numbers to analysts but getting the best insight from them takes some work. That is because of its several business units and how it computes certain ratios, and (unfortunate) changes it has made in the last year in what numbers it provides.
Total sales in 2017 were up 31% to an incredible $177.8 billion, but that includes digital media sales, subscriptions, and its rapidly growing profitable web services unit.
For a number of years I thought it was more interesting to look to look at what Amazon called "merchandise" sales, since that included a close analog to traditional retail sales and were most connected to a physical supply chain.
But Amazon no longer provides the merchandise sales numbers. It now provides "product" sales, but that includes, for example, sales at its Wholefoods grocery unit.
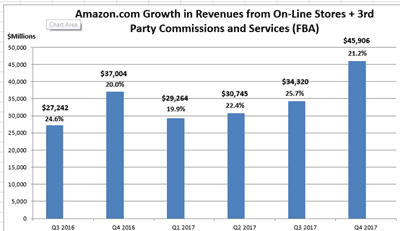
So I made up my own metric. I took what Amazon reports as sales from "on-line stores," then added revenues from what Amazon calls third-party services. That latter number includes commissions the company gets from its marketplace sellers, and revenues from Amazon's third-party logistics services, including Fulfilled by Amazon (FBA).
|
So growth from this view has also been strong, ranging between 20-25% year over year each quarter.
In the end, I am trying to adjust the numbers Amazon reports for things like shipping and fulfillment costs against the right denominator, using for many years the now unavailable merchandise sales. That's because including shipping in comparisons including say web services revenues doesn't make sense.
So I am going to use my hybrid number instead. But in another disappointment, while Amazon continues to report its total shipping expense (which is shipping only, not DC fulfillment), it has stopped reporting its shipping revenue, which allowed the calculation of net shipping costs, always a major loss for Amazon.
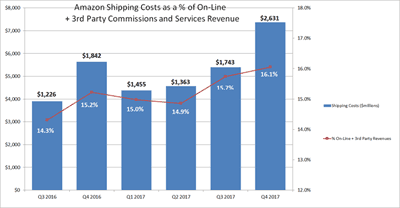
So I simply track below the total global shipping gross not net expense against my hybrid revenue number. This makes sense to me, because that would include revenue from on-line product sales plus the revenue from FBA, under which shipping is provided to clients. If anyone has a better way, let me know.
See Full Image
That ratio is coming out between 15-16% of those revenues, quite a lot - and lately rising. Though not reported, I am sure shipping still is a big loss leader for Amazon, probably several billion dollars per year.
I am out of room, even though I have more. Will do a part 2 on this as I did last year in a week or two.
Any reaction to these numbers from Amazon and Walmart? Any other data you would like to see? Let us know your thoughts at the Feedback button below. |

|
|
|
| |
|
|
On Demand Videocast: |
Digitizing the Order Management Process |

|
Orders Still come in Many Different Forms and Systems - Here's How to Get them Under Digital Control
This videocast discusses breaks down all the ways in which orders can arrive, the downstream challenges associated with each, and the benefits of digitization.
Featuring Dan Gilmore, Editor along with Esker's Sarah Joiner.
|
 |
| Now Available On Demand |
|
On Demand Videocast: |
Reducing Costs through Automated Inventory Replenishment & Analytics
|
 |
How Motor City Industrial Taps into Data Visualization to Help Customers Identify Waste, Reduce Inventory
This videocast discusses how to connect people, processes and technology across commerce and supply chain operations to achieve unified commerce.
Featuring Dan Gilmore, Editor along with Joseph Stephens, CEO, Motor City Industrial, Jay Fielder, Supply Chain Technology Manager, Motor City Industrial and Mike Wills, Chief Revenue Officer, Apex Supply Chain Technologies.
|
 |
Now Available On Demand |
|
On Demand Videocast: |
Yes, Retailers and Distributors Can Survive and Thrive by Unifying Commerce and Supply Chain
|

|
Integrated Approach will Improve Customer Experience as Smart Retailers Move Beyond Omnichannel
This videocast discusses how to connect people, processes and technology across commerce and supply chain operations to achieve unified commerce.
Featuring Dan Gilmore, Editor and enVista CEO Jim Barnes, a highly recognized industry expert on retail and distribution.
|
 |
| Now Available On Demand |
|
|
Feedback on 2018 Retail Deductions Study:

I was watching your update Monday on Trends in Retail Chargebacks.
I was surprised to hear that on time delivery was not ranked higher in the non-trade chargeback area.
Many of the grocery customer have put in new fees/fines similar to Walmart OTIF.
In this transportation environment, I would have expected a bigger impact here.
What are your thoughts?
Deb Schultz
Director, Transportation
Post Consumer Brands
Editor's Note:
I am not completely sure, but I believe the ranking was simply on most common occurrences. So, especially in apparel, having picking/packing errors in so-called split case cartons (different SKUs in one shipping carton) is relatively common, and thus it would not surprise me if that was more common than late shipments.
Think that is a reasonable explanation.
Dan Gilmore

|

What technology was Jessica referring to that can automate managing deductions for organizations?
Ashley Sobieck
Customer Compliance Manager
Perrigo Company plc
Response from Jessica Butler:
There are a number of different cloud-based technology tools out there that can automate various parts of the deduction management process. The tool that I feel is the most flexible and offers the most functionality is from HighRadius Corporation. They have a variety of different solutions across the entire AR process. Some of the deduction-related automation features include:
• Cash application pre-processing with customer specific rules to code deductions based on different customer remittance information
• Automatically retrieving claim documentation and PODs from customer & carrier portals and/or emails, eliminating manual effort associated with retrieving backup
• Creating 'pre-deductions' from claim documentation even before deductions have been received - allowing analysts to get a jump start on validation / research activities
• Centralized cloud-based portal to track deductions, upload documentation, add notes, route to various users, approval workflow
• Ability to automate dispute process on both customer portals and/or via email / fax / postal mail
o Auto populate / post disputes on customer portals for those who require disputes to be done via portal
o Auto generate customer correspondence to be emailed / faxed / mailed for things such as disputes, request for additional back up

|


![]()

![]()


