 |
March 23, 2017 - Supply Chain Flagship Newsletter |
 |
| FEATURED SPONSOR: AMBER ROAD |
||

 |
|
|||||||||||||||||||||||||||||||||||||||||||||||||||||||||||||||||||||||||||||||||||||||||||||||
|
||||||||||||||||||||||||||||||||||||||||||||||||||||||||||||||||||||||||||||||||||||||||||||||||
| In my first column, we also graphed the annual percentage growth for Walmart's US retail sales, which have slowed noticeably in recent years. Below we show the Walmart numbers in absolute terms across its three reporting units: US, Sam's Club, and International. All units have seen the pace of growth slow sharply, and the recent big slowdown in international is a bit puzzling (though rise of the US dollar is clearly playing some role). Basically, Walmart's total sales are close to flat since 2012. |
||||||||||||||||||||||||||||||||||||||||||||||||||||||||||||||||||||||||||||||||||||||||||||||||
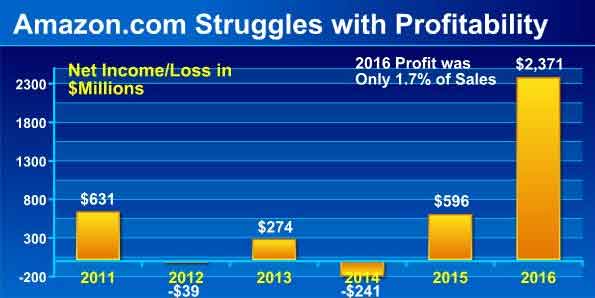
The cumulative average growth rate (CAGR) for each unit and total sales is shown beneath the chart. As you can see, Walmart has had an average CAGR of a pretty decent 4.46% for total sales from 2004 through 2016, but that clearly comes much more from the first half of that period than the last few years. Switching gears, Amazon get much criticism for its consistent failure to really make any money, but it saw a relative big jump in net income in 2016. But basically for now it is a not much above a breakeven business, making a little or losing a little each year and quarter, as shown in the chart below, where the 2016 million profit was just 1.7% of sales. That was up from a margin of just 0.5% in 2015. |
||||||||||||||||||||||||||||||||||||||||||||||||||||||||||||||||||||||||||||||||||||||||||||||||
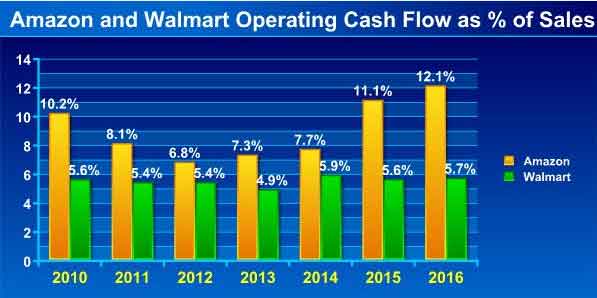
| But others say look instead at Amazon's cash flow from operations, which paints a better picture, and indeed operating cash flow has recently risen to be more than twice as high as Walmart's as a percent of revenue, as shown in the chart below. Note, however, the consistency of the Walmart numbers, for good or bad. Walmart is what it is. |
||||||||||||||||||||||||||||||||||||||||||||||||||||||||||||||||||||||||||||||||||||||||||||||||
About $1.7 billion of the $4.5 billion in Amazon's cash flow from operations came from the increase in net income. Another $2 billion came from increased depreciation expense, a number that is added back into cash flow.
Amazon had operating cash flow of $16.4 billion in 2016, and had CapEx of about $6.7 billion, up more than $2 billion from 2015. So that means CapEX was 41% of operating cash flow, way down from a whopping 72% seen in 2014. Walmart, on the other hand, had CapEx of about $11.5 billion, against $27.4 billion in operating cash flow, or 42% - almost exactly the same ratio as Amazon. (Note: as a proxy for official CapEx, I am using spending on real estate, equipment and technology). Importantly, Walmart, however, also has to pay a dividend from its cash flow- $6.3 billion worth last year - while Amazon does not. So Amazon's operating cash flow minus CapEx spend = $9.7 billion. Doing the same calculation with Walmart but also subtracting the dividend leaves it with just $9.6 billion in free cash - just a bit less than Amazon realized even though Walmart had $346 billion more in revenue. Wow. In the first column I calculated Amazon's net shipping costs as a percent of merchandise revenue, which is more relevant than looking at that ratio against total sales, which include electronic media and services for which no shipping is required. It was a hefty number - 6.2% in Q4. Now I am back this week doing the same thing for fulfillment costs - basically DC operations plus the depreciation expense for all those buildings and robots, and inbound freight, reported as a line item by Amazon. We calculated the ratio of that expense - which doesn't include shipping, by the way - again against merchandise sales, as shown below. |
||||||||||||||||||||||||||||||||||||||||||||||||||||||||||||||||||||||||||||||||||||||||||||||||
Wow, fulfillment costs of 18% of merchandise revenues last year. No wonder Amazon struggles to make any money - when do the savings from all those Kiva robots start kicking in? Add fulfillment and shipping costs together, and it's an amazing 24.2% of merchandise sales - against a gross margin of 35%. I could do more, but think that's enough for awhile - unless convinced otherwise. Any reaction to these numbers from Amazon and Walmart? Any other data you would like to see? Let us know your thoughts at the Feedback button below. |
||||||||||||||||||||||||||||||||||||||||||||||||||||||||||||||||||||||||||||||||||||||||||||||||
|
||||||||||||||||||||||||||||||||||||||||||||||||||||||||||||||||||||||||||||||||||||||||||||||||
|
||||||||||||||||||||||||||||||||||||||||||||||||||||||||||||||||||||||||||||||||||||||||||||||||


|
|
|


YOUR FEEDBACK
We received just a few feedbacks from last week's column on An Inflection Point in Supply Chain Planning? by SCDigest editor Dan Gilmore. But that includes a great response from consultant Dr. Chris Gopal, who thinks Gilmore is spot on.
You'll find his comments as well as a couple of other below.
Feedback on An Inflection Point in Supply Chain Planning?
![]()
Some thoughts on this piece:
Firs, this is an excellent and timely article and one, I think, which deserves to generate a lot of discussion. Given the excitement that is starting to get generated, it would be interesting, at this stage, to see the incremental projected benefits of these next-generation, AI- driven planning systems, relative to their total cost (acquisition, configuration, maintenance, change and implementation - including potential disruption in the "cracks" when one system is pulled out and another put in). I suspect these costs would be significant.
By "incremental" I mean those benefits that would be obtained net of what can be obtained via good business practices and improvements. It would be equally interesting to look at these costs/benefits v. those of the systems that are available today.
I bring up the "change" piece, because it seems that there are a potentially huge number of parameters and variables to consider in today's dynamic S&OP Process (now being called the "SI&OP Process). While these may be completely doable for "straight" processes that are wrinkle-free (third-party fulfillment, simple supply chains with few suppliers, few product variations, high resource-intensive manufacturing where the priority lies in equipment utilization, etc.), it becomes a little more daunting for other, more complex supply chains. Running thousands of scenarios is excellent (and may be required by the complexity of decision making), but at what point do we run into diminishing returns?
Among the factors that need to be considered (at different levels, anyway) are:
Decisions: The typical spectrum of decisions that have to be made includes Placing orders, Quantities, Suppliers/Source selection, Geographies, Manufacturing location/Source selection, Shipping/DC source selection, Shipment dates, Modes, Expediting/De-Expediting/Push-in/Pull-out, Direct to customer/DC, Shifting Customers and Destinations, etc.
Priorities which drive the decisions - Revenue, Margin, Working Capital and Inventory, Product, Customers and segments, Channel, Geography, Product Life Cycle
Trade-offs that must be factored in - functional metrics driven by Sales, Marketing, Finance, Operations
Trust in the system, the algorithms and "intelligence" built into the system (always an issue with executives, particularly when the complexities of the system are difficult to understand).
All these are subject to change (often frequent)- driven by changes in management (different executives have different priorities), economic and customer conditions (what's good today can be bad tomorrow, and vice versa) - and will be different by company and division.
The question: how would self-learning and the new AI-planning systems handle this? This may be a topic for future discussions in the column.
Again, a terrific piece.
Christopher Gopal, PhD
![]()
I think this was a very insightful column and I agree we may be entering a new world or era of supply chain planning based on analytics.
The challenge will be that so many companies are wedded to current planning technology and processes. So making the change to a new analytics-oriented platform will not be easy.
But we have had just incremental progress in planning technology for many years now. The technology you describe will bring step changes and paradigm shifts, and I agree that organization and processes will need to rapidly evolve to meet this "always on" planning environment.
How will that impact Sales & Operations Planning? That is a key question.
Roger Driscoll
Lafayette, IN

![]()
Dan Gilmore wrote: "I was very struck that at several of the case study breakout sessions, companies were simply limited in what they can do in demand and supply planning by a lack of staff. One well-known, global cosmetics firm cannot get to retailer-specific forecasting because it just doesn't have the human bandwidth, for example, a theme that ran through several of the presentations."
I think this company could benefit from Sparkcognition (Austin, TX). Based on what I know (my son works there) they make this easy. For another company they eliminated the need for a ton of people looking at the data.
Thomas A. Moore
Warehouse Optimization
SUPPLY CHAIN TRIVIA ANSWER
Q: How many manufacturing locations (factories) are there in the US?
A: 345,000, according to the most recent figures from the Bureau of Labor Statistics, down from 360,000 in 2008 but up a few thousand in the past few years.
| © SupplyChainDigest™ 2003-2017. All Rights Reserved. SupplyChainDigest PO Box 714 Springboro, Ohio 45066 |
POWERED BY: XDIMENSION
|