 |
August 16, 2013 - Supply Chain Newsletter |
 |
| FEATURED SPONSOR: KEWILL |
 |
Logistics in 2020: The Future is Closer Than You Think |
 |
|
||||||||||||||||||||||||||||||||||||||||||||||||||||||||||||||||||||||||||||||
Systems Thinking in Supply Chain Part 2For one of just a handful of times, SCDigest Editor Dan Gilmore is turning over his First Thoughts column to a guest contributor, David Schneider. Always provocative, Schneider has been a guest before. He currently runs consulting firm David K. Schneider & Associates, after a position as a logistics executive at retailer Pep Boys, and has held as a number of other roles in the supply chain before that. He is also the founder of the wearethepractioners supply chain blog.
In part 1 of this two-part guest First Thoughts series, I stated rather boldly that true systems thinking by managers and executives in the supply chain is relatively uncommon. (See Systems Thinking and the Supply Chain.) I offered by way of an easy example of the lack of systems thinking in the inbound freight, receiving and putaway process, which in the vast majority of times has clearly not been engineered in a true systems fashion across shipper, carrier and receiving company, with resulting inefficiencies. This is often true unfortunately even if the shipper is the manufacturing plant of the receiving company.
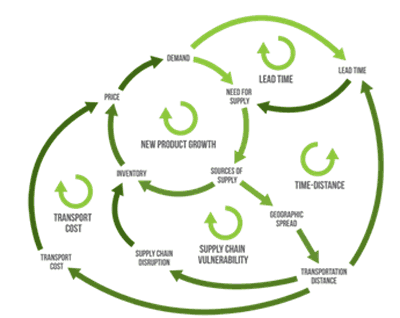
I also maintained that probably just the supply chain "cream" - maybe 10-12% of companies - operate with a high level of systems thinking, and even they fall shortin many instances, in part because thinking and acting in a siloed or more limited fashion is almost always the path of least resistance. Also discussed was that visualization is very important to communication supply chain challenges and solutions. Most managers and team members will react better to a graphic summarizing a system than they will to just words describing it. From there, I introduced the concept of the "causal diagram" as a key tool in the systems thinking playbook. Introduced some 50 years ago, I have had great success using the technique in the supply chain for a number of years myself to drive systems thinking and supply chain improvement. We simply do not draw enough causal diagrams of the supply chain systems we work in. Without drawing a causal diagram, we have a hard time visualizing the relationships between the variables in our system. So this week, let's look at this model I introduced last week in more detail, which focuses on the new product development process (and which came straight from APICS). It is actually a somewhat simple system, with only ten nodes of influence and just only five cycles (both are important concepts in causal diagrams). Example Causal Diagram
The core of the model is the New
Product Growth. This loop is a reinforcing loop, where each cycle of the loop reinforces the action, like a snowball rolling down a hillside. Without friction and with no end to hill or snow, the snowball builds in size and momentum. Surrounding the core engine of this supply chain system are four interdependent systems. Each of these systems influences the core from the outside, slowing it down and influencing the growth. Think about our snowball rolling down the hill. If the snow is light and dry, the snowball can't pick up as much weight as it rolls down. The light snow creates rolling resistance. The wind can push the ball off course, the snow can run out, etc. Each of the balancing systems in our chart above will slow down the speed of our New Product Growth. Longer transportation distances increase the transportation cost and the lead-time. Longer distances also increase risk of disruption. A longer lead time can affect the inventory we need, indirectly, as supply chain vulnerability increases. As the conditions of each of these different influencing factors changes, the resistance that each of the balancing systems places on the engine changes too. Simple, Inaccurate, and Incomplete As I pointed out, this diagram is basic and simple. It is also incomplete and inaccurate. Addressing "incomplete" first, the financial aspects of the supply chain are missing. There is no system depicting the available working capital or cash-to-cash cycle. That is no surprise, since supply chain analyses often do not include the complex financial aspects behind the supply chain. The model also fails to recognize other influences on demand, such as promotion or competition. Specific to competition, the system is not just the competition from a competing supply chain (competitive company) - it can be in the form of a substitute product that does the same job. With regard to the inaccuracy claim, the lead-time loop is in the wrong place. While transportation influences lead-time, demand really does not, and lead-time may not influence the need of supply as much as it influences the decisions about the amount of inventory. Cognitive Ability Causal diagrams are fundamental tools that support systems thinking. There are several other tools, and causal diagrams alone are often not sufficient to understand complex systems. But they are an important technique that all supply chain managers should have in their tool boxes. Causal diagrams are also effective in more focused applications, such as the inbound receiving process referenced above, improving pick wave creation, release and completion in a distribution center, and in fact any area of the supply chain. The key in each case is looking beyond the obvious core process elements to the other processes and influences connected to the main thread. Such an approach can also minimize the "law of unintended consequences," such as when productivity initiatives lead to reduced quality, or efforts around "carrier bid optimization" result in service troubles due to too many new carriers unfamiliar with customers and service requirements. One of my colleagues talks about the cognitive ability of the managers to see and understand the inherent complexity of the supply chain. He talks about the required wet wear to see, think and talk about the complexities of the different influences. I don't think that our cognitive ability is at fault, it is more of an issue of our will to use our cognitive skills to think in a systems fashion. Systems thinking is not a new practice. Professor Jay Forrester started teaching "system dynamics" in the mid 1950s at MIT's Slone Business School. It is not an issue of ability, it is an issue of awareness and willingness. Frankly, the problem with many supply chain managers is that they often do the first damned thing that pops into their mind. This brings us full circle to my opening statement last week: We supply chain managers often maintain and feed an illusion that we understand and employ systems thinking in the execution of our duties. In most cases, we act based on our experience, not thinking of the other factors influencing the living system of which we are managing a small part. We usually influence only a portion of the system, and that means to get real results that benefit the entire supply chain we must focused relentlessly on internal and often external collaboration. My final thought: Take the next problem you need to solve. Are you and your team really taking a systems thinking approach to develop the solution? Are you drawing pictures that visualize the system, and that embrace the multiple influences and consequences of the core process being analyzed? If so, you are well ahead of most in the supply chain, I can say with conviction. Do you agree or disagree that companies often don't use systems thinking to guide supply chain decisions? Why or why not? Ever used a causal diagram? Let us know your thoughts at the Feedback button below.
|
|||||||||||||||||||||||||||||||||||||||||||||||||||||||||||||||||||||||||||||||
|
|||||||||||||||||||||||||||||||||||||||||||||||||||||||||||||||||||||||||||||||
|
|
|
YOUR FEEDBACK
A modest amount of Feedback on our columns in recent weeks on Inventory Performance 2013, featuring SCDigest analysis of the overall working capital numbers provided to us by REL, a Hackett Group company.
That includes our Feedback of the Week from David Armstrong of Inventory Curve, who has some very sharp observations we know you will find of value.
Feedback of the Week - On Inventory Performance 2013
I always enjoy look at this report. So here are some comments. 1) As you note, the report is based on the way REL reports the numbers. I don't have a problem with this. You clearly spell out the methodology and it is consistent, both across the 1,000 public companies included in the report and from year to year. As a result, comparisons are possible. 2) In your example using Owen's Corning, you note that the "55.4 days of DIO could be compared to its inventory turns level of 5.5 days (CGS divided by inventory level). But you can by no means say every company with DIO of 55.4 days has inventory turn of 5.5. The margins/CGS vary by company, making that linkage impossible." That is correct, but using the methodology REL using, one can compute an approximate Inventory turnover based on the DIO number. That is simply 365/DOI. In the case of Owens Corning, this calculation is 365/55.4 = 6.6. While a different calculation from inventory turnover based on CGS which reflects margins, it still can provide a method to look at turnover relationships across the 1,000 companies and the 56 sectors you have identified based on the REL methodology. 3) Using your Sector DIO report, I made an additional cut as shown below:
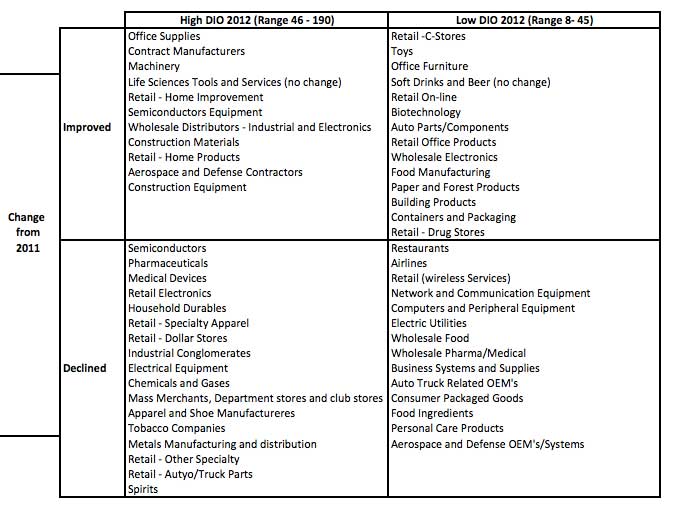
On the horizontal axis, I split the DIO into high and low ranges with the median, 45 days as the break point. The break on the vertical axis are based on the performance improvement or decline from 2011 to 2012. Here is the sector breakdown:
Upper Right Quadrant: In lowest half of DIO AND had improvement over 2011 - 14 sectors Lower Left Quadrant: In highest half of DIO AND also had decline over 2011 - 17 sectors Upper Left Quadrant: In highest half of DIO with improvement over 2011 - 11 sectors Lower Right Quadrant: In lowest half of DIO, but with decline over 2011 - 14 sectors.
4) You indicate that the REL report also includes DSO (Receivables) and DPO (Payables). With this information it should be easy to calculate the Cash to cash cycle for each organization. Given how REL calculates DIO and how they might calculate DPO, the analysis would be slightly different from the "standard" calculation of C2C, however, it would be consistent and allow comparison across the 1,000 companies represented. David J. Armstrong |
||
| More Feedback on Inventory Performance | ||
Thanks for informative article on inventory. Confirms my experience with retail inventory. John White |
||
Thank you so much for this excellent analysis. I know it was a lot of work to do the segmentation and further analysis of the REL data the way you do. I think you are correct, it does appear that as a whole we have somewhat hit an inventory plateau. Interesting - shouldn't all this supply chain software done something about that by this point? How can there be all these case studies on inventory success, yet the numbers not reflect it? Dallas Myers Jacksonville, FL |
||
Another measure of inventory performance is average inventory days held during the year ; this shows a drop of 5% from 2011 to 2012 [130 days to 123 days ; formula used = ((Opening inv+Closing inv)/2) / (COGS/365)]. Definitely progress made but nowhere near the stratospheric levels as the 21%. However if one were to consider that the proportion of direct to consumer business increased from 27% in 2011 to 29% in 2012 and with the expectation that DTC adds a whole more to inventory than a pure wholesale model, then I'd rate it a good performance. Colin Pereira
|
||
| How to access 2013 DIO data ? Used to get via CFO mag but might have discontinued this?
Find this info more valuable then inventory turns. Editor's Note: SCDigest receives the actual data from REL under a special arrangement. It is more extensive than the portions of that data that used to be made available from CFO. Unfortunately, we cannot make the raw data available. David Wright |
SUPPLY CHAIN TRIVIA ANSWER
Q: In what year did each of the following US industry sectors reach their peak levels of US output? (1) Food, (2) Apparel, (3) Chemicals, (4) Pharmaceuticals, (5) Automobiles.
A: Food – 2013, Apparel – 1994, Chemicals – 2007; Pharmaceuticals – 2006, Automotive – 2013, according to Federal Reserve data.
| © SupplyChainDigest™ 2003-2013. All Rights Reserved. SupplyChainDigest PO Box 714 Springboro, Ohio 45066 |
POWERED BY: XDIMENSION
|


