 |
August 9, 2013 - Supply Chain Newsletter |
 |
| FEATURED SPONSOR: KEWILL |
 |
Logistics in 2020: The Future is Closer Than You Think |
 |
|
||||||||||||||||||||||||||||||||||||||||||||||||||||||||||||||||||||||||||||||
Systems Thinking in Supply ChainFor one of just a handful of times, SCDigest Editor Dan Gilmore is turning over his First Thoughts column to a guest contributor, David Schneider. Always provocative, Schneider has been a guest before. He currently runs consulting firm David K. Schneider & Associates, after a position as a logistics executive at retailer Pep Boys, and has held as a number of other roles in the supply chain before that. He is also the founder of the wearethepractioners supply chain blog.
Do supply chain managers regularly deploy systems thinking in the planning and execution of their operations? Perhaps controversially, I believe that to answer Yes to this question is frequently an exaggeration at best, and somewhat imaginary at worst.
When working with an organizational structure, like a supply chain, the system is the combination of the people, structures, processes and environment that work together (or don't work together) to create a desired outcome. A healthy system consistently delivers the desired outcome. An unhealthy system often delivers less than the desired results. Yet while nearly all of us recognize the supply chain as a system, I will maintain most managers and executives do not really operate that way on a consistent basis. While you may disagree with me generally or from what you believe is your own personal style of decision-making, I challenge you to go watch the receiving dock of any large distribution center and ask yourself, how much systems thinking did the companies receiving the goods and shipping into this operation really employ? Not much, many of you will agree. The entire system from supplier to receiving to putaway was not well considered.
But I will state that it is only the supply chain cream that are masters of systems thinking. How much cream is there? Who knows - but if we apply the ratio of cream to cow's milk, one pint per gallon, then about 12% of the corporate supply chains are the cream, well using systems thinking. That leaves 88% of the supply chains that may not apply systems thinking processes, or do so only some of the time, or don't really take it all the way through. Following the logic of Garrison Keillor's Lake Wobegon "where all the women are strong, all the men are good-looking, and all the children are above average," most supply chain managers would like to think that they employ systems thinking. The real truth is that the majority of them don't. I have seen far more examples of a lack of systems thinking in supply chain over 28 years in this business than I have good practice of it. While I do believe that there is a small core of real systems thinkers in supply chain management, I also believe there are far more managers who would like to believe they approach their supply chains using systems thinking to solve problems, but only partially think at a true systems level. It's just been my experience. Systems Thinking and Causal Diagrams Anybody out there remember the last time they drew a causal diagram? If I use the cream logic, about 12% of the readers here remember the last time they did. Let's get more selective. Has anybody used a causal diagram in the past month? How many today even really know what a causal diagram is? We live in a complex environment, surrounded by complex systems of people, things and actions. Most supply chain activities, even when they look simple on the surface, can be very complex under the covers. Our ability to visualize the components of a system, the interaction between the components, and understand the outside influences on the system directly affects our ability to understand the complexity of that system. Visualization is key to cognitive ability - and is often critical to be able to understand what is really going on. Something I learned a long time ago was that it is hard to think about something that is complex without drawing a picture of it. Most of us use white boards, flip charts, chalkboards, paper, and bar napkins (often the best!) to get our ideas across to people, and to work out ideas with ourselves. So, let me ask a different question: How many of you in the past day used some sort of drawing to help you think? I bet a decent percentage of you say yes, and that's a start. But was it a causal diagram? Likely not. As supply chain managers, we like to talk about getting to the root cause of a problem, not treating the symptom, but fixing the cause first because that fixes the problem for good. In fact, many of us are proud about our desire to get to the root cause. However, if you look at the way problems get solved in the supply chain, we often in fact never really get to the root cause. There are many reasons for this lack of success, and one is we don't draw enough causal diagrams of the systems we work in. What on earth am I talking about? The best way to illustrate is to illustrate. Example Causal Diagram
This diagram is straight out of APICS. It is a systems model that focuses on the new product development, illustrating the complexity of a single supply chain. As complex as it looks, this is really a basic, simple model. There are only ten nodes of influence, and only five cycles. I would bet that some of us live with supply chains far more complex than this. Still, this is a complete and concise starting point that covers the primary components of any supply chain. Without drawing a causal diagram, it is very difficult to visualize the relationships between the variables in our system. Without the diagram, we force our visualization to the words we use, our verbal skills. I am pretty sure I have a good vocabulary; and am able to write and speak with sufficient skill. Still, it does not matter how good I am if the people I am working with don't know my language. If they don't understand the terms, or can't understand the relationships I see, or don't think primarily in words as some do, I am going to have a hard time expressing my ideas in a way they can well understand. I have been using causal diagrams with great success for more than 50 years. You could say that causal diagrams are the heart of systems thinking. As Dan Gilmore is wont to say, alas I am out of space for this week. I'll be back in a week or two with the second part of this series, where we will dig into systems thinking and causal diagrams for the supply chain in more depth. Between now and then, consider how well or not your company really applies systems thinking to the supply chain, and whether a technique causal diagrams might be a good visual approach for many supply chain challenges. My experience with working with many companies is that such skills could often use some improvement. Do you agree or disagree that companies often don't use systems thinking to guide supply chain decisions? Why or why not? Ever used a causal diagram? Let us know your thoughts at the Feedback button below.
|
|||||||||||||||||||||||||||||||||||||||||||||||||||||||||||||||||||||||||||||||
|
|||||||||||||||||||||||||||||||||||||||||||||||||||||||||||||||||||||||||||||||


 Of course we have many very good logistics operations today. You may work in one of them. The major retailers, larger consumer products companies, and the leading manufacturers build solid logistics systems, and the best supply companies are almost by definition those that well utilize systems thinking. But probably even these performance leaders fall short on occasion. The reality is that a system thinking approach is usually more work than using a limited, siloed methodology - a practical barrier to its usage.
|
|
|


YOUR FEEDBACK
A modest amount of Feedback on our columns in recent weeks on Inventory Performance 2013, featuring SCDigest analysis of the overall working capital numbers provided to us by REL, a Hackett Group company.
That includes our Feedback of the Week from David Armstrong of Inventory Curve, who has some very sharp observations we know you will find of value.
Feedback of the Week - On Inventory Performance 2013
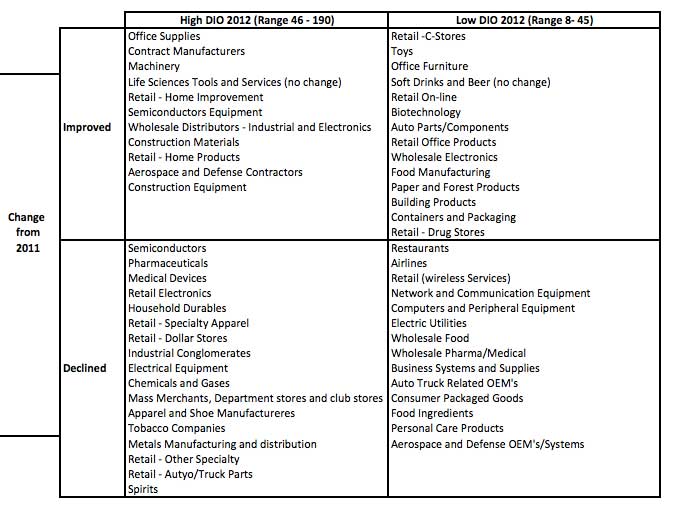
I always enjoy look at this report. So here are some comments. 1) As you note, the report is based on the way REL reports the numbers. I don't have a problem with this. You clearly spell out the methodology and it is consistent, both across the 1,000 public companies included in the report and from year to year. As a result, comparisons are possible. 2) In your example using Owen's Corning, you note that the "55.4 days of DIO could be compared to its inventory turns level of 5.5 days (CGS divided by inventory level). But you can by no means say every company with DIO of 55.4 days has inventory turn of 5.5. The margins/CGS vary by company, making that linkage impossible." That is correct, but using the methodology REL using, one can compute an approximate Inventory turnover based on the DIO number. That is simply 365/DOI. In the case of Owens Corning, this calculation is 365/55.4 = 6.6. While a different calculation from inventory turnover based on CGS which reflects margins, it still can provide a method to look at turnover relationships across the 1,000 companies and the 56 sectors you have identified based on the REL methodology. 3) Using your Sector DIO report, I made an additional cut as shown below:
On the horizontal axis, I split the DIO into high and low ranges with the median, 45 days as the break point. The break on the vertical axis are based on the performance improvement or decline from 2011 to 2012. Here is the sector breakdown:
Upper Right Quadrant: In lowest half of DIO AND had improvement over 2011 - 14 sectors Lower Left Quadrant: In highest half of DIO AND also had decline over 2011 - 17 sectors Upper Left Quadrant: In highest half of DIO with improvement over 2011 - 11 sectors Lower Right Quadrant: In lowest half of DIO, but with decline over 2011 - 14 sectors.
4) You indicate that the REL report also includes DSO (Receivables) and DPO (Payables). With this information it should be easy to calculate the Cash to cash cycle for each organization. Given how REL calculates DIO and how they might calculate DPO, the analysis would be slightly different from the "standard" calculation of C2C, however, it would be consistent and allow comparison across the 1,000 companies represented. David J. Armstrong |
||
| More Feedback on Inventory Performance | ||
Thanks for informative article on inventory. Confirms my experience with retail inventory. John White |
||
Thank you so much for this excellent analysis. I know it was a lot of work to do the segmentation and further analysis of the REL data the way you do. I think you are correct, it does appear that as a whole we have somewhat hit an inventory plateau. Interesting - shouldn't all this supply chain software done something about that by this point? How can there be all these case studies on inventory success, yet the numbers not reflect it? Dallas Myers Jacksonville, FL |
||
Another measure of inventory performance is average inventory days held during the year ; this shows a drop of 5% from 2011 to 2012 [130 days to 123 days ; formula used = ((Opening inv+Closing inv)/2) / (COGS/365)]. Definitely progress made but nowhere near the stratospheric levels as the 21%. However if one were to consider that the proportion of direct to consumer business increased from 27% in 2011 to 29% in 2012 and with the expectation that DTC adds a whole more to inventory than a pure wholesale model, then I'd rate it a good performance. Colin Pereira
|
||
| How to access 2013 DIO data ? Used to get via CFO mag but might have discontinued this?
Find this info more valuable then inventory turns. Editor's Note: SCDigest receives the actual data from REL under a special arrangement. It is more extensive than the portions of that data that used to be made available from CFO. Unfortunately, we cannot make the raw data available. David Wright |
SUPPLY CHAIN TRIVIA ANSWER
Q: Match the following companies with the smaller supply chain software vendors they acquired: (1) IBM, (2) JDA Software, (3) Oracle), (4) Logility, (5) Infor, (6) SAP; (A) Demantra, (B) Optiant, (C) i2, (D) EXE Technologies, (E) iLog, (F) SmartOps.
A: 1E, 2C, 3A, 4B, 5D, 6F.
| © SupplyChainDigest™ 2003-2013. All Rights Reserved. SupplyChainDigest PO Box 714 Springboro, Ohio 45066 |
POWERED BY: XDIMENSION
|