Over the last several weeks, we've done extensive analysis on the inventory performance of US companies in 2012 and over time, based on data provided to SCDigest by REL, a Hackett Group company.
REL tracks overall working capital performance, of which inventory is a key component (in addition to changes in receivables and payables).
REL uses the metric Days
Inventory Outstanding, or DIO, to measure inventory performance, which
calculates how many days of sales a company is holding in inventory, and
which REL defines as:
End of Year Inventory Level/[total revenue/365]
As such, DIO is
sort of the reverse of inventory turns, in that a higher DIO, all things
being equal, means poorer inventory management performance, while a
lower number signals improvement. You are being more efficient with
inventory versus a given level of sales.
We have already looked at this from several angles - readers can start at the following link, which has links to the other articles as well: Which Companies have Seen Strong Inventory Performance Since 2006?
Finally for this year, we take a look at overall DIO performance across the product-based companies out of the 1000 largest companies that REL assembles data on. In other words, SCDigest deletes from our add-on analysis of the REL data companies that are in sectors such as banking, insurance, oil and gas, etc., to focus on those in manufacturing, retail and wholesale with traditional inventory profiles.
That left about 550 out of the original 1000 this year. Since 2005, it has varied between about 500 to 550 companies. Below, we show the aggregate DIO performance of those companis from 2005 on.
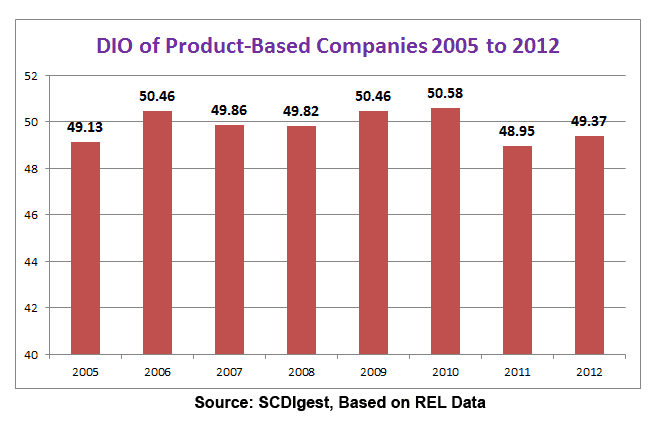
There is a small caveat here, in that companies come in and out of the list, as they are acquired, taken private, don't make the REL cut, etc. That might have some modest impact on the total in any individual year, but we're confident these numbers are generally correct in terms of trends.
And that trend is: flat inventory performance overall over the past eight years. There was a bit of a rise in 2009 and 2010 related to the recession, a nice dip down back in 2011, but then a .8% rise in 2012. That is consistent with the governments's inventory-to-sales numbers, which have also largely tracked flat over the past decade, and show a blip up in the second half of 2012.
Some argue that the flat performance is actually impressive, given the factors working to push inventory levels up: SKU proliferation, longer supply chains, more volatile demand, etc.
Maybe. All we'll say is that it is obvious that actually reducing inventories is very, very difficult.
Any Feedback on our Supply Chain Graphic of the Week? Let us know your thoughts at the Feedback button below. |


