Kearney says it does a number of validation steps on the data submitted, asking companies to relook at their data if certain responses seem out of whack of norms or previous submittals.
The high level insight is that there is a huge range of results across companies in terms of return from their investment in procurement. As shown in the chart below, leaders receive a return equal to about 11 times their investment, while the median company (50% level) achieves a return of just 4.5 on those dollars. The worst companies barely get any return at all, seeing payback equal to less than their investment, at a ratio of just .8.
Source: ATKearney
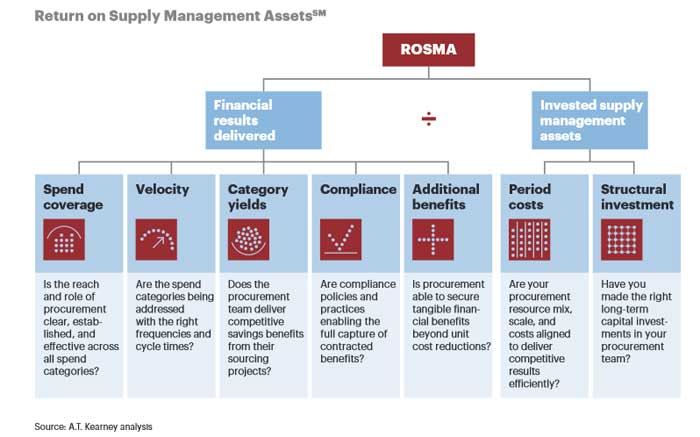
So, how does that disparity happen? Again, without being real sure how each element is measured, you can see in the chart below that leaders perform much better across different ROSMA inputs, such as percent of total spend managed, cycle times for new contracts (velocity), compliance rates, etc. that do middle and lagging companies.
Source: ATKearney
Top Procurement Companies Use More Advanced Techniques
Not surprisingly, part of what makes procurement leaders better performers is simply that they avail themselves of more advance techniques in the discipline.
Most procurement organizations routinely apply only 12 of the 64 (19%) proven methods in Kearney's "purchasing chessboard" framework - a list of techniques that can be used in various sourcing scenarios.
What's more, Kearney's research also shows that most organizations do not expand the assortment of methods they have mastered over time.
By contrast, leading procurement teams use more than 25 methods. More than double that of the average company.
The report says that top-quartile performers consistently apply the following advanced practices:
• Actively track and report project pipeline (inbound), in process (status), and results of procurement projects
• Monitor project cycle times
• Perform periodic reviews of procurement process governance roles by category
• Emphasize development of, proficiency in, and expansion of sourcing capabilities and methods
• Provide three-way validation of procurement benefits (procurement, businesses, and finance)
• Require transparent reporting of procurement staff productivity and critical process KPIs, such as compliance and requisition-to-pay practices
• Maintain levels and functionality of technologies deployed and associated adoption rates
• Provide evolution and mix of resources over time
The report also says it expects to see more procurment leaders adopt an array of emerging practices, including:
• Mapping stakeholder satisfaction across projects, time, and team members to monitor team and network strength and reach (applying social media practices)
• Launching best procurement athlete recognition programs (talent visibility)
• Applying machine learning (text mining) to address tail spend opportunities faster
• Embedding tracking analytics to monitor and capture sources and impacts of cost variances due to order and engineering changes
In the end, the report says that just 2.5% of companies are procurement "brand leaders," while another 6.3% are close, categorized as "leaning up."
The vast majority - 77.4% - are stuck in "the pack" of middling performance, while 13.8% are simply "inconsequential."
All told, this is a rather "in your face" report that lays down some real challenges to procurement organizations, among the most interesting being how much return a company is actually getting from its investments in sourcing.
What do you think of the aproach in this report? Is there a big variance on the return from procurement investment across companies? Let us know your thoughts at the Feedback button (email) or section (web form) below.

|