|
|
 |
Focus: Sourcing/Procurement
Feature Article from Our Sourcing and Procurement Subject Area - See All |
|
From SCDigest's On-Target e-Magazine
June 1, 2011
Supply Chain News: Graphically Representing Supply Risk Across Three Dimensions
Reader Responds with Smart Way to Add Velocity Dimension to Familiar 2 X 2 Framework of Likelhood and Impact
SCDigest Editorial Staff
SCDigest Says: |
 |
Keep velocity as a dimension, said Tom Haber Senior Manager, Enterprise Risk Management at EPCOR Risk, Assurance & Advisory, but use another approach to illustrating that graphically.
|
|
What Do You Say?
|
|
|
|
In our Supply Chain Graphic of the Week last week, we shownd a couple of iterations of a supplier risk framework familiar to most supply management professionals, in which risk is rated along two dimensions: likelihood/probability and then impact. (See Supply Chain Graphic of the Week: Adding a Velocity Dimension to Risk Management.)
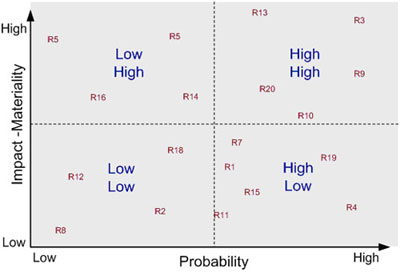
Some use a simple 2 x 2 approach, in which both dimensions are rated as either high or low, resulting in four quadrants in which various risks can be assigned, generating in turn different levels of mitigation strategies, as shown below.
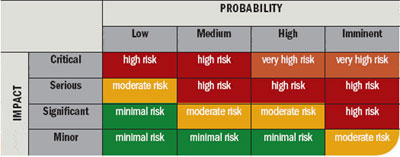
Many have taken this same basic concept and decided that two dimensions (low and high) do not provide enough granularity, and so have simplty segmented the two dimensions into more categories, giving a more nuanced breakdown of probability and impact, as shown in the graphic below, and leading to an even more targeted set of appropriate mitigation strategies.
At the recent Institute for Supply Management (ISM) conference, we noted that supply management veteran Robert Kemp had suggested that companies should consider adding a third variable to the mix - velocity,
In other words, in addition to likelihood and impact, how fast an event would impact a company is another dimension to consiider, and will also impact appropriate mitigation strategies. An event that will be slower to have an impact obviously gives a company more time to respond shoukd it occur. While there is probably some overlap with the veliocity dimension with impact/materiality, we agree that adding velocity to the framework makes sense.
But how to do it graphically? Should companies build a complicated three-dimensional chart? How would that best be done?
(Sourcing and Procurement Article Continues Below) |
|
CATEGORY SPONSOR: SOFTEON |
| |
| |
|
|
|
SCDigest Reader to the Rescue
As is often the case, a Supply Chain Digest reader came to the rescue.
Keep velocity as a dimension, said
Tom Haber Senior Manager, Enterprise Risk Management at EPCOR Risk, Assurance & Advisory, but use another approach to illustrating that graphically.
"My answer is: Don't try to represent velocity as a third dimension. You are trying to build something overly complex that will likely not be practical. Instead, keep velocity as an overlay to the traditional impact/likelihood risk grid," Haber wrote us. "When you plot the risks on the grid, code them another way to show the velocity (another colored point or a different type of point). Most leading practices show risk velocity in that fashion."
In this example, from the analysts at the Corporate Executive Board, the two dimensions of likelihood and impact are still used, but now the velocity of each supply chain risk is indicated by using a different color, in a familiar red, yellow, green traffic light type of graphic approach.
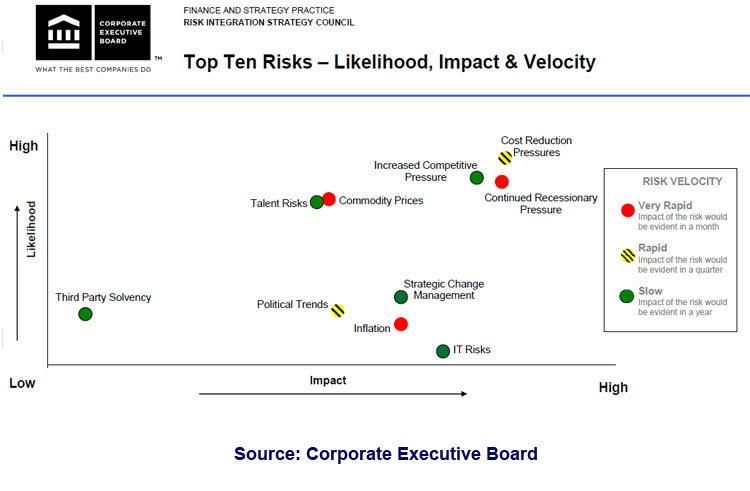
We definitely like this approach more than trying to come up witha three-dimensional model, but now wonder if it would be even better to use an icon, like a race car for very rapid, a regular car for rapid, and VW Bug or something for slow, instead of colors.
We would still welcome your suggestions for how to best add velocity - or other dimensions - to a risk framework graphic. Let us know at the Feedback button below.
|
|
Recent Feedback |
2011-06-02
I`ve seen the use of `risk velocity` or `speed of onset` many times over the past few years. These concepts tend to attract the attention of senior leaders because they evoke emotional responses. But I believe there is little practical value, as discussed here.
Adding a third dimension to risk complicates the risk management process. Dealing with the two dimensions of likelihood and consequence and their ratings is difficult enough. Outside of the world of risks for which much data exist (eg workers comp, automobile, some nat-cat events) the accuracy of likelihood and consequence ratings is subject to perception-bias: both time-relevant (recentness) and personal (a person`s journey through life results in automatic biases of what is and is not relevant).
Velocity, speed of onset, and similar measures do not add value to deciding which risk events are most important and which should be treated. These measures do, however, play a critical role in deciding how to treat a risk event. The faster the risk event manifests itself and the quicker consequences are felt, the sooner you need to be able to detect the onset of the risk event and the quicker you must be able to respond to the risk event.
Take an earthquake or tornado for example. These events have extremely high velocity from the standpoint of consequences. But will we treat them differently than another risk event? Likely not. We`ll base our risk treatment on likelihood of the event and the magnitude of the consequences. If the consequences are great, a company could develop a second, geographically separated, production site as a risk treatment.
There may be some value in differentiating risk events with a third dimension using time horizon of when the risk event will occur. Even this method can be problematic, however. A risk event that won`t happen for 5 years may require actions starting today to develop adequate treatment, perhaps to prevent the risk event from happening. Many regulatory risks fall into this category.
Attached is an attempt at depicting a third dimension to risk. This has never proved practical in use, however, and I don`t condone its use.
John J. Brown, PE
Director, Risk Management
Supply Chain Development
The Coca-Cola Company
|
|
| |
| |
|
|
|

