From SCDigest's On-Target E-Magazine
May 25 , 2011
Logistics News: Annual WERC DC Metrics Study Finders Leaders Extending their Lead
Manrodt says Accelerating Peformance from the Best Word of Caution to Everyone Else; The 10 Most Frequently Used Metrics for 2011
SCDigest Editorial Staff
As usual, the annual benchmark study of DC performance metrics was released at the Warehouse Education and Resource Council's (WERC) annual conference, held recently in Orlando. (See our video review of WERC 2011).
The study, now in its eighth year, is based on responses from over 500 logistics professionals, and is compiled and analyzed by Dr. Karl Manrodt of Georgia Southern University, and Kate Vitasek and Joseph Tillerman of Supply Chain Visions.
SCDigest Says: |
 |
"Best-in-class performers got better this year. What you are starting to see is this big divide occurring. The best are getting better at a faster rate than everyone else."
Dr. Karl Manrodt |
|
What Do You Say?
|
|
|
|
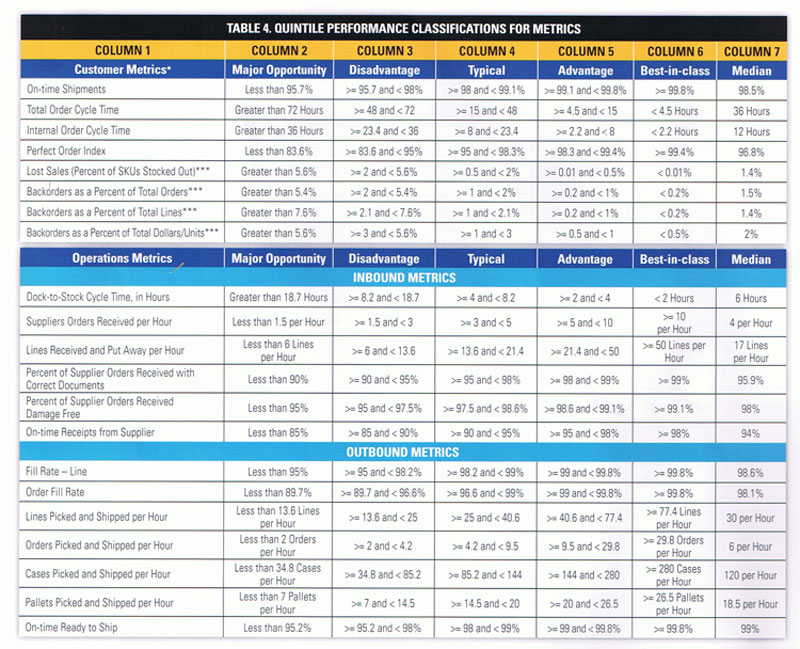
The study looks at a wide variety of metrics, and breaks the responses down into quintiles, or 20% ranges that go from "best in class" at the top to "Major Opportunity" at the bottom, a euphemism for the worst 20% of performers in each category.
The report also focuses on the median score for each metric, as Dr. Manrodt says the median (half below, half above) is a more meaningful figure to consider as the mid-point of performance, versus using the average score for each measure, which he believes is more subject to a few extreme scores than the median number is.
Most Commonly Used Metrics
The 2011 report once again charts the 10 most commonly used distribution-related metrics, and there was a bit of a turnover this year. The table below, created from the report, ranks DC metrics by the percent of respondents that said each metric was used in their operations.
As can be seen from the table below, several measures changed positions significantly from 2010 to 2011, and two entered the top 10 that were not ranked at all the previous year.
Most Commonly Used Distribution Metrics 2011 |
2011 Top Ten |
2010 Rank |
1. On-Time Shipments |
1 |
2. Warehouse Capacity Utilization |
4 |
3. Order Picking Accuracy |
2 |
4. Peak Warehouse Capacity Utilization |
9 |
5. Dock to Stock Time |
6 |
6. Internal Order Cycle Time (order to shipment) |
10 |
7. Total Order Cycle Time (order to delivery) |
Didn't make top 12 |
8. Lines Picked/Shipped per Hour |
11 |
9. Lines Received/Put Away per Hour |
Didn't make top 12 |
10. Damage-Free Receipts |
Didn't make top 12 |
We are certainly surprised that no cost-related metrics such as distribution costs as a percent of sales or distribution cost per case or unit made the top 10 list.
Manrodt told SCDigest at the WERC conference that there was not a lot of change in the data from the 2010 results, but that it is clear companies overall are continuing to make progress.
"Of the 40 metrics we study, 52% either improved or stayed the same for 2011 versus 2010," Manrodt said. He added that most of the metrics that showed median performance decreases in 2011 were related to cost, which is always subject to more year over year variability than other measures.
"Best-in-class performers got better this year," Manrodt also observed. "What you are starting to see is this big divide occurring. The best are getting better at a faster rate than everyone else."
"This should be a word of caution for other companies" Manrodt added.
(Distribution/Materials Handling Story Continues Below)
|