sc digest
 
July 20, 2018 - Supply Chain Flagship Newsletter
border

This Week in SCDigest

bullet 1H 2018 in Supply Chain in Numbers and Charts bullet SC Digest On-Target e-Magazine
bullet Supply Chain Graphic & by the Numbers for the Week bullet Distribution Digest
bullet New Cartoon Caption Contest Begins bullet Trivia      bullet Feedback
bullet Expert Column bullet On Demand Videocasts
 

THIS WEEK'S SPONSOR: ZEBRA TECHNOLOGIES


Discover Enterprise Scanners, Mobile Computers, Tablets and Printers


first thought

SUPPLY CHAIN NEWS BITES


Supply Chain Graphic of the Week
US 3PL Market Back on Strong Growth Track


bullet

CO2 Back on the Rise in 2017

bullet
Productivity Gains All Going to Largest Firms
bullet
DC Space gets Even Tighter in Q2
bullet
UPS will US AI to Predict Parcel Flows
   

MADE BY ZEBRA
FASTER DELIVERY BY DAVID
Discover Enterprise Scanners, Mobile Computers, Tablets and Printers


NEW CARTOON CAPTION CONTEST BEGINS

July 16, 2018 Contest


See The Full Cartoon and Send in Your Entry Today!


Feature Story: Target Testing Extreme New Lean-Oriented Store Replenishment Model with "Flow Centers"


ONTARGET e-MAGAZINE
Weekly On-Target Newsletter:
July 18, 2018 Edition


New Cartoon, Delivering for Amazon, Tariffs Impact, BP Energy Report 2018, More


EXPERT INSIGHT
The Three "Ps" of Sales & Operations Planning Success


by Henry Canitz
Product Marketing & Business Development Director
Logility

EXPERT INSIGHT
Create A Micro Supply Chain for Each Customer Order

by Martin Verwijmeren
Chief Executive Officer
MP Objects

NEW REPORT PROVIDED BY SOFTEON


TRIVIA QUESTION

What is the share of so-called "regional" parcel carriers of the total US market?

Answer Found at the
Bottom of the Page


1H 2018 in Supply Chain in Numbers and Charts

It is a big time cliche, but a picture really is worth a 1000 words.

I can say that definitively, because when I put together these reviews of the past year or half year in supply chain, the graphics I use really do tell the story - wish I had room for more.

Last week, I provided a month by month chronology of the top stories for the first six months of 2018, which you will find here: What Happened in Supply Chain in 1H 2018?

GILMORE SAYS:


Spot market load availability set a record in June, increasing by 9.3% month-over-month and 18% compared with June 2017, according to the DAT Freight Index.

WHAT DO YOU SAY?

Send us your
Feedback here

This week, I am back with a look at the 1H in what I call numbers and charts. So let's go.

In an important change, the economic environment that has such a big impact on our supply chains went from lukewarm in the 1H in 2017 to what seems to be the strongest economy in many years.

Q1 real GDP growth came in at a so-so 2%, but that was up from Q1 2017's rate of just 1.4%, as Q1 numbers have been weak for many years running for reasons economists can't explain.

But the Q2 numbers, soon to be released, are expected to be better - perhaps much better. The Federal Reserve Bank just said that growth in the second quarter was "considerably stronger than the first."

Could we see the first year of real GDP growth for the first time (amazingly) since 2005? Looks like that is a real possibility, which would end a longer stretch without that level of growth than has been seen for decades (I checked back to 1950) and perhaps in the history of the US, at 12 years running.

The IMF's just released forecast predicts overall global economic growth of 3.9% for both this year and next, up a bit from 2017 (3.7%). It expects as usual developing economies (4.9%) to grow much faster than developed ones (2.4%). The IMF, however, is also concerned rising trade wars could cut those expected growth levels.

The IMF also predicts global trade growth of 4.5% for 2018, notably above its forecast for global economic growth. That is back to how it was from the 1990s until the Great Recession. Then something changed, and global trade fell below GPD growth, playing havoc on ocean carriers which had loaded up on capacity.

eCommerce rolled on, up 16.4% in the US in Q1, the last data point from the US Commerce Dept., and 16.8% in Q4 2017, as the growth rate stays 14-16% quarter after quarter, much faster of course than brick and mortar retail growth. But total retail sales were up a solid 4.9% through June, though that number includes restaurant sales. Still, good news for brick and mortar.

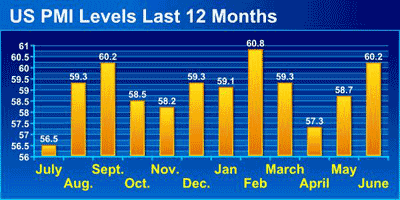
US manufacturing once again provided some mixed signals. The US Purchasing Managers Index from ISM was largely on fire, well above the 50 mark that separates manufacturing expansion from contraction in each month of the 1H, with June's 60.2 illustrating the economic strength seen it appears in Q2 (see graphic below).


See Full Image


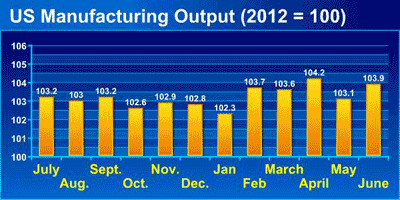
But as was true last year, the data coming from the US Federal Reserve on US manufacturing output was less positive, showing basically flat output for most months, as show in the graphic below. June's for production level, for example, was up a modest 1.9% versus the prior year. I do not know how to reconcile the difference between what the ISM and Fed data say. And at a level of 103.9, it means June output was up just 3.9% from the baseline year of 2012, six years later.


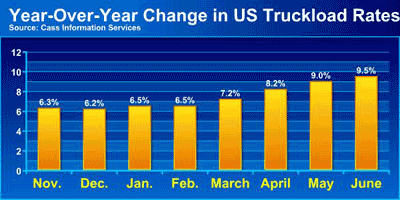
In a dramatic change from 1H 2017, transportation costs soared. The Cass Linehaul Index, which measures US truckload rates, was way up in the first six months of the year, rising between 6.5% and 9.5% year over year, as shown in the chart below. The June increase was the highest in the history of the index dating back to January 2005.


Freight demand combined the driver shortage has the market firmly in the hands of the carriers. Spot market load availability set a record in June, increasing by 9.3% month-over-month and 18% compared with June 2017, according to the DAT Freight Index. DAT adds that compared with June 2017, contract rates jumped by 19%, and spot market rates are up 29% year-over-year. Spot rates are also unusually above contract pricing - another sign of these unusual times.

The ATA Freight Tonnage Index was up 8% through May versus 2017, far outpacing the annual gain of 3.8% in all of last year.

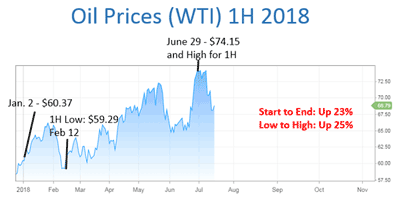
Oil prices were very interesting, continuing the rise starting in the second half of 2017 The price started January at $60.37, rising to the the highest price of the 1H on the last trading day ($74.15), an increase start to end of 23%.


See Full Image


However, it was not quite as bad for diesel pricing, which started the year at $2.97 and ended at June at $3.23, and increase of a more modest 9%.

There is more but I am totally out of space. Hope you have enjoyed these two reviews of the 1H in supply chain.

Any reaction to this review of 1H 2018 in numbers and charts? Let us know your thoughts at the Feedback button below.


On Demand Videocast:

Digitizing the Order Management Process


Orders Still come in Many Different Forms and Systems - Here's How to Get them Under Digital Control

This videocast discusses breaks down all the ways in which orders can arrive, the downstream challenges associated with each, and the benefits of digitization.


Featuring Dan Gilmore, Editor along with Esker's Sarah Joiner.

Now Available On Demand

On Demand Videocast:

Reducing Costs through Automated Inventory Replenishment & Analytics


How Motor City Industrial Taps into Data Visualization to Help Customers Identify Waste, Reduce Inventory


This videocast discusses how to connect people, processes and technology across commerce and supply chain operations to achieve unified commerce.


Featuring Dan Gilmore, Editor along with Joseph Stephens, CEO, Motor City Industrial, Jay Fielder, Supply Chain Technology Manager, Motor City Industrial and Mike Wills, Chief Revenue Officer, Apex Supply Chain Technologies.


Now Available On Demand

On Demand Videocast:

Yes, Retailers and Distributors Can Survive and Thrive by Unifying Commerce and Supply Chain

Integrated Approach will Improve Customer Experience as Smart Retailers Move Beyond Omnichannel

This videocast discusses how to connect people, processes and technology across commerce and supply chain operations to achieve unified commerce.


Featuring Dan Gilmore, Editor and enVista CEO Jim Barnes, a highly recognized industry expert on retail and distribution.

Now Available On Demand

YOUR FEEDBACK

We had a couple of good questions from our video interview with Jessica Butler, on the new report on trends in retail chargebacks from her company, Attain Consulting Group. See the questions and the responses below.

Feedback on 2018 Retail Deductions Study:

comma

I was watching your update Monday on Trends in Retail Chargebacks.
I was surprised to hear that on time delivery was not ranked higher in the non-trade chargeback area.
Many of the grocery customer have put in new fees/fines similar to Walmart OTIF.
In this transportation environment, I would have expected a bigger impact here.
What are your thoughts?

Deb Schultz
Director, Transportation
Post Consumer Brands

Editor's Note:

I am not completely sure, but I believe the ranking was simply on most common occurrences. So, especially in apparel, having picking/packing errors in so-called split case cartons (different SKUs in one shipping carton) is relatively common, and thus it would not surprise me if that was more common than late shipments.

Think that is a reasonable explanation.

Dan Gilmore


comma

What technology was Jessica referring to that can automate managing deductions for organizations?

Ashley Sobieck
Customer Compliance Manager
Perrigo Company plc


Response from Jessica Butler:

There are a number of different cloud-based technology tools out there that can automate various parts of the deduction management process. The tool that I feel is the most flexible and offers the most functionality is from HighRadius Corporation. They have a variety of different solutions across the entire AR process. Some of the deduction-related automation features include:

• Cash application pre-processing with customer specific rules to code deductions based on different customer remittance information
• Automatically retrieving claim documentation and PODs from customer & carrier portals and/or emails, eliminating manual effort associated with retrieving backup
• Creating 'pre-deductions' from claim documentation even before deductions have been received - allowing analysts to get a jump start on validation / research activities
• Centralized cloud-based portal to track deductions, upload documentation, add notes, route to various users, approval workflow

• Ability to automate dispute process on both customer portals and/or via email / fax / postal mail

o Auto populate / post disputes on customer portals for those who require disputes to be done via portal
o Auto generate customer correspondence to be emailed / faxed / mailed for things such as disputes, request for additional back up


comma


SUPPLY CHAIN TRIVIA ANSWER

Q: What is the share of so-called "regional" parcel carriers of the total US market?

A: Just 2% in 2017, according to the recently release 2018 State of Logistics Report.

© SupplyChainDigest™ 2003-2018. All Rights Reserved.
SupplyChainDigest
PO Box 714
Springboro, Ohio 45066
POWERED BY: XDIMENSION