 |
July 31, 2015 - Supply Chain Flagship Newsletter |
 |
| FEATURED SPONSOR: ZEBRA |
||
 |
||
Download Our Complimentary White Paper Now To Learn the Ten Steps to Finding the Right Mobile Device |
 |
|
||||||||||||||||||||||||||||||||||||||||||||||||||||||||||||||||||||||||||||||||||||||||||||||||||||||||||||
Once again this year, REL has been kind enough to send me the data set for some further analysis. The just released 2015 data is based on year-end 2014 financials from some 1000 US public companies. It is great stuff, but the big value-add SCDigest performs here is to re-sort individual companies into new categories, so the categories and comparisons in our view are more usable for supply chain thinking. For example, in the original REL data, home builders like Toll Brothers are mixed in the household durables category with companies like Whirlpool. That may have been the most "apples and oranges" combination, but there were a number of others that don;t jive, at least from a supply chain perspective. Metal producers such as US Steel were in the same category as miners, in another example. So, we do the (really) hard work of first eliminating sectors that aren't useful for the supply chain (e.g., bankers, etc.), and then redefining and populating the categories in a way that makes more sense for comparisons. As another example, rather than having one giant category of all specialty retail, we break that down into apparel, department stores, auto parts, etc. It really does take a lot of time. It is far from perfect. Should Johnson & Johnson be placed in the pharma group, the medical device category, or consumer packaged goods, as it is in all those segments? Is Honeywell in the aerospace or automotive sector, or one of the few "industrial conglomerates" like GE or 3M? That's where we put it again this year. There are many such examples where the call is not obvious. In the end, we simply made choices, including looking up more details on a number of companies with which we were not familiar, even though we look up many.
DIO means how many days of sales a company is holding in inventory, and which REL defines as:
|
|||||||||||||||||||||||||||||||||||||||||||||||||||||||||||||||||||||||||||||||||||||||||||||||||||||||||||||
End of Year Inventory Level/[total revenue/365] |
|||||||||||||||||||||||||||||||||||||||||||||||||||||||||||||||||||||||||||||||||||||||||||||||||||||||||||||
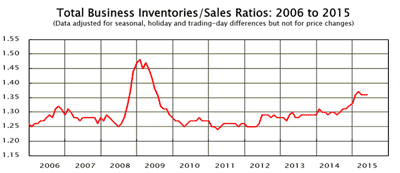
As always, I want to make clear this is the definition that REL uses in its data set. Every year, someone writes in telling me DIO should be calculated differently, and my response is that this is the way REL calculates DIO, so that is what I must therefore use (and I think it is right anyway). Also, REL must use DIO, not inventory turns, so it is compatible with the other two components of working capitol, Days Sales Outstanding (receivables) and Days Payables Outstanding. The main working capital formula wouldn't work with a turns number. As such, DIO is sort of the reverse of inventory turns, in that a higher DIO, all things being equal, means poorer inventory management performance, while a lower number signals improvement. You are being more efficient with inventory versus a given level of sales. So, let's take an example. Retailer Costco had about $112.64 billion in sales in 2014. Divided by 365 days in a year, that means the company sold about $308.6 million worth of stuff every day. It also ended the year with $8.45 billion in inventory. So dividing that inventory number by the $308.6 million in sales per day means Costco held on average inventory equal to about 27.4 days of its sales. Apple, by contrast, manages to hold just about 6 sales sales days worth of inventory, though that figure is helped by its iTunes sales that I assume have no inventory at all. Construction and farm equipment company John Deere held about 62 sales days worth of inventory last year. In case you were curious, Costco's 27.4 days of DIO could be compared to its inventory turns level of 11.6 (cost of goods sold divided by its inventory level). But by no means can we say that every company with DIO of 27.4 has an inventory turn of 11.6. The margins/cost of goods sold vary by company, making that linkage impossible, unfortunately. In the overall US economy, inventory levels have remain relatively flat or even headed up a bit since about 2005, when compared to sales. As seen in the chart below, the "inventory to sales" ratio did spike in late 2008/early 2009 as the recession caught companies with way more inventory than needed versus suddenly shrinking demand, but they then chopped away at that inventory ruthlessly, so that it was back on the longer term trend line by early 2010. However, according to this government data, inventory levels have actually been trending slightly up in recent periods, probably as top line growth becomes more and more the priority (note: this is a monthly measure, which is why it is greater than 1 - inventory/monthly sales). It has been slightly ticking down over the last few months. Numbers are very similar cross sectors: manufacturers: 1.31 in May; retailers excluding autos: 1.29; wholesalers: 1.19. But all told, inventory performance has gotten worse since 2005 - interesting.
Now, back to the REL data. Across all 1000 companies, REL finds DIO is down 0.2% year over year, down 0 .7% since 2010, and down about 2% since 2004. Across all 1000, DIO in 2014 was 43.1. However, among the 574 product companies from the list SCDigest analyzed, average DIO was much higher, at 77 days, but down 1% or so from 2013. One thing that is really striking in doing this work across years is seeing how concentrated so many US business sectors have become. Office products retailers? We're went down to two a couple of years ago, after Office Depot swallowed OfficeMax. Next year it will be one, after Staples finishes acquiring Office Depot. Molson Coors stands alone in the Beverages - Beer category, the only public US brewer left. Next year, giants Kraft Foods and Heinz will leave the Food Manufacturers list, both acquired by the same private equity firm. Consolidation a megatrend.
So all that doesn't leave me much room here. Next week, I will publish the full analysis across about 65 sectors. Below, some highlights:
Top 5 lowest DIO sectors: (1) Retail Convenience Stores: 8.4; (2) Restaurants: 12.6, and which would be number 1 if not for Starbucks (I think its coffee making side is the cause); (3) Business Furniture (19.3); (4) Retail Grocery: 30.1; and (5) Printing: 30.2
Top 5 highest: (1) Spirits: 287.6; (2) Retail Auto Parts: 208.9; (3) Pharma: 177; (4) Biotech: 161.2; (5) Life Sciences Equipment: 151.1 Other notable sectors:
Food Manufacturing:59.5 Chemicals and Gases: 76.8 Apparel and Shoe Manufacturing: 112.2 Mass Merchants and Dept. Stores: 78.6 Consumer Packaged Goods: 64.6 Computers and Peripherals: 41.7
I'll save the rest for next week, including what sectors have had the best improvement. Good stuff. Would love your thoughts.
|
|||||||||||||||||||||||||||||||||||||||||||||||||||||||||||||||||||||||||||||||||||||||||||||||||||||||||||||
|
|||||||||||||||||||||||||||||||||||||||||||||||||||||||||||||||||||||||||||||||||||||||||||||||||||||||||||||
|
|||||||||||||||||||||||||||||||||||||||||||||||||||||||||||||||||||||||||||||||||||||||||||||||||||||||||||||
|
|
|
YOUR FEEDBACK
We received some a number of emails on our story on the small retail chain Peltz Shoes publicly abandoning its item-level RFID program, some through are partnership with the good folks over at RetailWire. You will find a selection below.
Feedback on Peltz Shoes RFID Failure:
Source tagging is the key. Also, it sounds to me that someone did not setup the printing process correctly. There is a method to read, write, verify, and log the RFID tag during the printing process. This is NOT what the printers do normally and not what most of the label prep packages do. Without it, this can happen. So that does not surprise me. I do think it is odd to do a press release on a failure though. Tom O'Boyle
|
||
Peltz has some solid points but it sounds like the people that helped deploy his RFID operation did an install and split. The system must be maintained properly. Peltz might have decided to not pay maintenance fees which would add to the problems. We are missing all the facts for a full post-situational analysis. Tom Redd |
||
I gotta say, this sounds like sour grapes to me rather than fundamental issues with the technology. Plus, if they made their tagging technology purchases in 2009 - I mean, there have been two to three new generations since then of both the tags and the readers. It's surprising to me to find that a six-store chain was willing to take this kind of project on. And rather than focus on RFID for the supply chain, I might have recommended that they start with one store. For shoes I always thought the benefits came from store associates not having to go back and check to see if they have the shoe a customer wants in the right size - they could get the inventory while standing with the customer. Sounds like an odd project: odd design, odd motivation, odd focus. Having said that, I'm definitely not necessarily defending the technology. But it just goes to show that any technology needs a defined project, a pilot with specific goals and a plan for how to take that pilot to a wider implementation. Sounds like several of those steps were missing. |
||
The global supply chain is based on RFID, from raw materials to the end user. It is not designed to be unique for a single shoe store. Peltz experiences are not surprising. The idea of having store labor add the chips is ludicrous. The chip should be part of the manufacturing process when the shoes leave the manufacturer. The box can then be followed from China or Italy across oceans to docks to warehouses to trucks to the store.
What is happening here is that high-level productivity technology is being implemented by low-level non-tech labor.
Gene Detroyer |
SUPPLY CHAIN TRIVIA ANSWER
Q: Only one of the following US manufacturing sectors is currently producing more now than it did in 2007 – which one: Metals, Chemicals, Pharma, Industrial Gases, Household Appliances?
A: Metals, with production in June 1.6% above average monthly 2007 volumes, according to Federal Reserve data. All the other four choices were below 2007 output.
| © SupplyChainDigest™ 2003-2015. All Rights Reserved. SupplyChainDigest PO Box 714 Springboro, Ohio 45066 |
POWERED BY: XDIMENSION
|


