The annual state of logistics report is just out with much fanfare from Rosalyn Wilson and CSCMP, with the headline news that overall US logistics costs rose 10.4% in 2010 to 8.3% of GDP. That is after two years of logistics cost decline, especially the dramatic, recession-induced slide in 2009 to just 7.9% of GDP. In 2007, logistics costs were calculated at 9.9% of GDP, so we are still well below that recent peak.
| GILMORE SAYS: |
" Wilson notes that in 2010, "Freight volumes grew year over year, but unsteadily. There were frequent spikes and valleys in the monthly tonnage, carload, intermodal and container data." "
WHAT DO YOU SAY?
Send us your
feedback here
|
This represents the 22nd edition of the report, which was launched in the late 1980s by the late Bob Delaney and sponsored by his company, Cass Information Systems. Somewhere along the way, CSCMP took over the sponsorship, and in the late 1990s Wilson, who has a long career in the logistics industry, began to support Delaney in his efforts. Upon Delaney's passing, Wilson took on the challenge alone, largely keeping the existing methodology.
Over the past couple of years, the report has received even more hype, with a corporate sponsor (Penske), a panel discussion of supply chain executives and more at the Washington DC report launch event. I was not able to make that press conference, but as always will summarize report here.
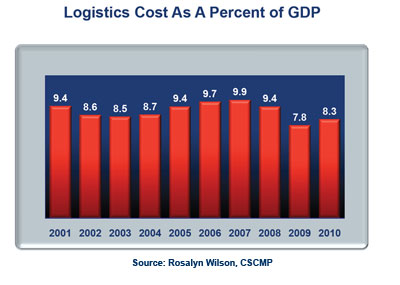
As background, US logistics cost rose sharply from 2003 (8.5% of GDP) through the 2007 peak. As the recession somewhat invisibly started in the first half of 2008 and then came on with a vengeance in the last quarter, 2008 logistics costs decline for the first year since 2003, almost astounding given that was the year oil prices reached near $150 per barrel by mid-year. Even then, logistics costs for the full year were estimated at 9.4% of GDP.
The 10-year chart of logistics costs as a percent of GDP is shown below.
View Full Size Image
The calculation of total costs is actually quite complex and includes such things as oil moving through pipelines, but in the end has two major and two minor cost components. One of the majors is inventory carrying costs, which includes such things as interest costs, taxes, insurance and all the costs of warehousing. The other is transportation. There is a very minor line item for "shipper related costs" (never figured that one out) and a somewhat larger one for "logistics administration," which includes IT and other overhead related costs. Neither of these costs has much impact on the totals.
The breakdown of these cost can be seen in our Supply Chain Graphic of the Week nearby, which shows that both major cost components were up over 10% in 2010, with total logistics costs reaching about $1.2 trillion. From an absolute cost level, that puts us back to 2005 levels, but the percentage is lower because GDP was greater in 2010 than it was then, believe it or not.
The increases in inventory and transportation costs reflect both increases in volumes and the actual "per unit" costs themselves. So the actual decline in interest rates during the year, for example, was more than offset by the amount of increase in total inventories. Absolute US business inventories increased by about 10% in 2010 to $2.1 trillion, though with an inventory to sales ratio at the end of the year of just about 1.25, that metric is near the recession low points, after rising a bit earlier in 2010. In 2006, the ratio averaged about 1.33, and in statistical terms the drop to 1.25 is actually pretty significant and shows the intense corporate focus on reducing inventory levels.
The report uses the commercial paper (short term) interest rate for calculating the interest cost expense of those inventories, and those rates fell in 2010 to just .20%, from .26% the previous year (hence why our bank accounts pay virtually no interest).
Wilson says warehousing costs declined 6% in absolute terms in 2010 versus 2009, which I find hard to believe given the rise in volumes year over year, but many companies did significant DC consolidation during the recession, so maybe this is so. Wilson also points out that the excess DC capacity in the US has led to sharp reductions in lease rates.
The cost increases in transportation for 2010 were primarily for increased fuel costs (up about 20%) and some increases in volumes, with higher rates a minor factor, especially from the beleaguered trucking sector.
Wilson notes that in 2010, "Freight volumes grew year over year, but unsteadily. There were frequent spikes and valleys in the monthly tonnage, carload, intermodal and container data."
Trucking costs increased just 9.3% in 2010 on an absolute basis, on a rise in tonnage of 5.7% for the year, and rising fuel surcharge costs supplying most of the rest of the increase. The spend in all other modes combined rose 15.4%. That is due both to mode shifting away from truck to rail and intermodal, as well as stronger pricing power in many of those modes versus trucking. Railcar loadings increased a strong 7.3% and intermodal volumes were up even more at a 14.2% gain in 2010. Combined with strong pricing power, railroad revenues were actually up more than 21% for the year.
A few other highlights from the report:
- Wilson says carriers currently are only recovering about 70% of the recent increases in fuel costs as surcharge payments from shippers. If this is true, it is much different than the early days when fuel surcharges were a profit center, and a recipe for financial disaster for carriers.
- Industrial production in the US was up 5.3% in 2010, after a decline of 11.2% in 2009. However, almost all of that increase was from industrial type goods, while growth in consumer products production was flat in the face of weak retail sales numbers.
- Despite the transportation volume gains in 2010, only about half of the volumes lost during the recession have returned. However, in all modes but ocean carriage (who have received delivery recently of many new megaships ), ruthless capacity reduction has kept the supply-demand balance roughly in equilibrium, with signs that balance is moving in the carriers' favor.
- More than 3000 trucking firms have gone bankrupt in the last three years, reducing total industry capacity by 13%.
- Air freight volumes grew sharply in the 1H of 2010, as companies were willing to pay higher rates to keep inventories very low. By the second half, that trend reversed itself, with even many high tech products that had traditionally been shipped via air going by boat. Air freight capacity is down about 12% globally.
We have several more of these factoids in our Supply Chain by the Numbers section.
I will note as I have for the past several years that I wish Ms. Wilson, who does a great job on this, would add a factor in here that somehow notes growth in the pure services sector of the economy versus that of the "product" economy. If the services sectors are growing faster than the product sectors, than the growth of logistics costs winds up being understated. Hope I am being clear on that, though I realize it is complicated because services such as retail are obviously an important part of the product economy.
The report is available at no charge for CSCMP members, of which I am one. Think it can also be purchased there by non-members, though I believe with at best modest effort a copy can otherwise be obtained.
Any reaction to this year's state of logistics report? Anything surprise you? What are your expectations for 2011? Let us know your thoughts at the Feedback button below.
|


 Holste's Blog:
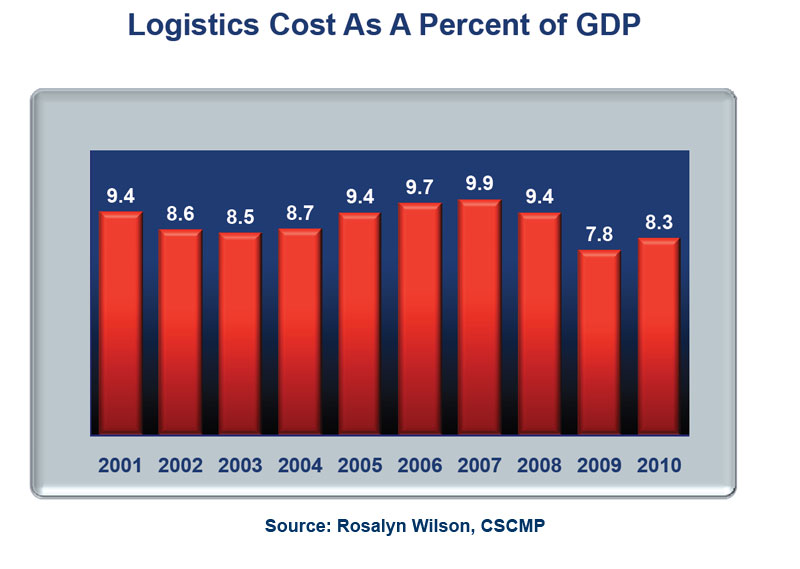